How Does Space Weather Affect Radio Communication?

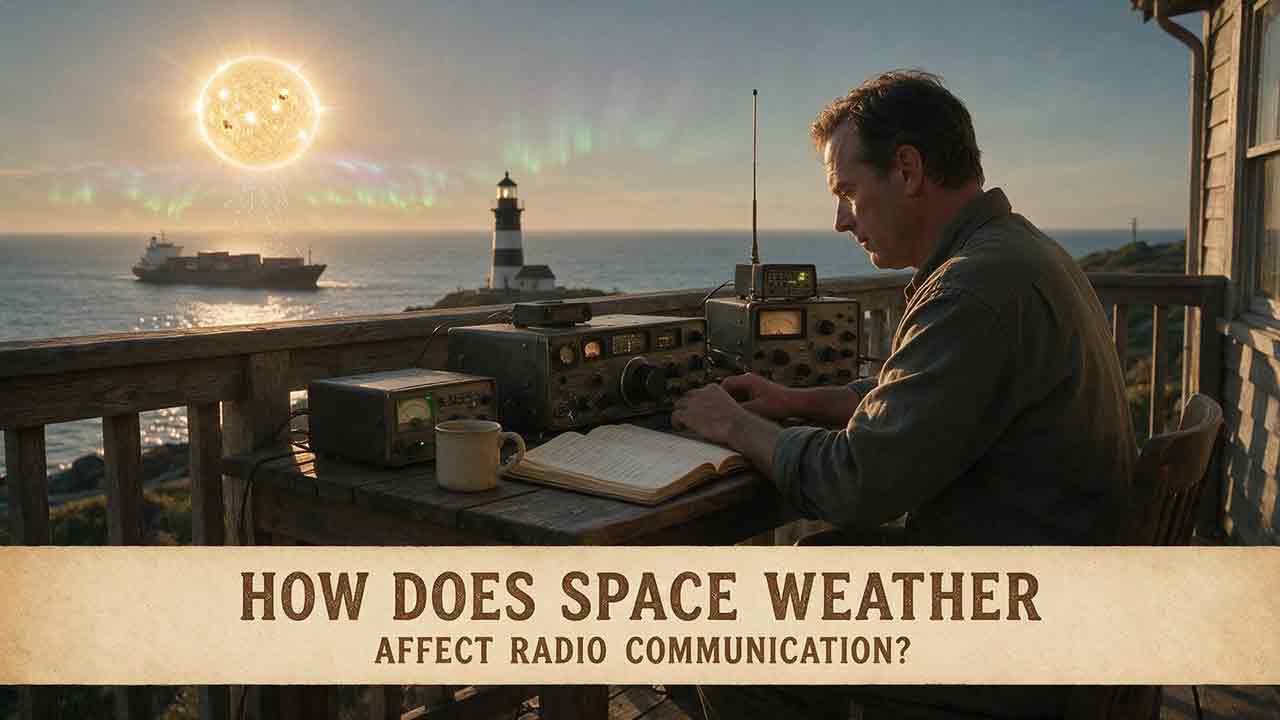
How Does Space Weather Affect Radio Communication?
Space weather affects radio communication by changing the ionosphere—the electrically charged region used by HF radio and crossed by satellite signals. Solar flares can almost immediately absorb dayside HF signals when their radiation reaches Earth, energetic particles can weaken polar routes, and geomagnetic disturbances can alter propagation or trigger scintillation. Users may experience fading, reduced range, interference, timing errors, or temporary loss of contact.
Key Takeaways
- Solar-flare radio blackouts can begin almost immediately when enhanced X-ray and extreme-ultraviolet radiation reaches Earth.
- Solar radiation storms are especially important on polar routes, where energetic particles can create prolonged HF absorption.
- Geomagnetic storms can change which HF frequencies and paths remain usable, but the result is not identical in every region.
- Satellite and GNSS signals may fade or lose lock when irregular ionospheric plasma disturbs signal amplitude and phase.
- The correct response depends on the mechanism. Moving higher in frequency helps in some cases, while moving lower or changing the signal path is more effective in others.
This guide explains how different kinds of space weather affect HF, VHF, UHF, satellite, and navigation signals. It also provides a practical diagnosis method, a worked historical example, and a simple link-margin calculation for understanding why a radio link may fail.
Who Is This Article For?
This article is intended for:
- Amateur radio operators
- Emergency communication planners
- Aviation and maritime communication users
- Satellite and GNSS users
- Infrastructure and network managers
- Students and general readers
- Organizations that depend on geographically distributed radio links
It is not a substitute for approved aviation procedures, maritime safety requirements, emergency operating plans, spectrum regulations, equipment documentation, or instructions from a network operator.
Safety-critical users should treat space-weather information as one operational input, not as permission to depart from established communication procedures.
How Does Space Weather Interfere With Radio Signals?
Space weather interferes with radio communication mainly by changing the density and structure of charged particles in the ionosphere.
The ionosphere overlaps Earth’s upper atmosphere and the edge of space. Solar radiation removes electrons from atmospheric atoms and molecules, creating ions and free electrons. NASA notes that radio and GPS signals may pass through this region or depend on it to reach their destinations, so changes in ionospheric density and composition can disrupt those signals.
NASA: 10 Things to Know About the Ionosphere
Radio systems interact with the ionosphere in two main ways:
HF skywave communication uses the ionosphere.
The ionosphere can refract HF signals back toward Earth, allowing communication far beyond the normal line-of-sight horizon.Satellite communication passes through the ionosphere.
Satellite, navigation, and timing signals must cross the ionosphere between space and a ground receiver.
A disturbance can affect these signals through several different mechanisms.
Absorption
A radio wave loses energy while passing through a sufficiently ionized region. Severe lower-ionosphere absorption can prevent an HF signal from reaching the higher layer that would normally return it toward Earth.
Refraction Changes
Changes in electron density alter how a radio signal bends. An HF signal may return to Earth at a different location, pass over the intended receiver, or continue into space.
Scattering
Small-scale plasma structures redirect parts of a signal along slightly different paths.
Scintillation
Interference between differently refracted or scattered signal components creates rapid amplitude or phase changes. A receiver may experience fading, data errors, or loss of signal lock.
Propagation Delay
The ionosphere changes signal phase and travel time in a frequency-dependent way. This is especially important for satellite navigation and precision timing.
Increased Received Noise
A solar radio burst can raise the noise level near a receiver’s operating frequency. In this case, the wanted signal may still arrive, but the receiver has more difficulty separating it from the background.
Which Types of Space Weather Affect Radio Communication?
“Space-weather interference” can describe several physically different events. Identifying the event type is essential because the affected paths, symptoms, and useful responses are not the same.
| Space-weather event | Main physical mechanism | Most exposed radio path | Typical symptom | NOAA scale |
|---|---|---|---|---|
| Solar-flare radio blackout | X-ray and extreme-ultraviolet radiation increases lower-ionosphere ionization | HF paths on Earth’s sunlit side | Sudden fading, reduced range, or temporary HF blackout | R1–R5 |
| Solar radiation storm | Energetic particles increase ionization in polar regions | Polar and high-latitude HF paths | Polar-cap absorption and prolonged degradation | S1–S5 |
| Geomagnetic storm | Magnetospheric energy disturbs the upper ionosphere | High-latitude HF and trans-ionospheric paths | Changed usable frequencies, unstable propagation, or fading | G1–G5 |
| Ionospheric scintillation | Small plasma irregularities disturb signal phase and amplitude | Satellite, GNSS, and other Earth-to-space paths | Rapid fading, data errors, or receiver loss of lock | No single NOAA severity scale |
| Solar radio burst | Natural solar radio emission raises the received noise floor | Systems operating near the burst frequency | Reduced signal-to-noise ratio or interference | Event-dependent |
NOAA uses separate scales because radio blackouts, radiation storms, and geomagnetic storms are not interchangeable phenomena.
- The R scale describes flare-related radio blackouts.
- The S scale describes solar radiation storms.
- The G scale describes geomagnetic storms.
NOAA Space Weather Prediction Center: NOAA Space Weather Scales
A high Kp value may support a diagnosis involving geomagnetic disturbance, but Kp does not directly measure flare-driven lower-ionosphere absorption.
How Do Solar Flares Cause HF Radio Blackouts?
A solar flare can cause an HF radio blackout when its X-ray and extreme-ultraviolet radiation sharply increases ionization in the lower ionosphere on Earth’s sunlit side.
The electromagnetic radiation from a flare travels at the speed of light. When it reaches Earth and is detected by near-Earth instruments, the direct dayside ionospheric effect begins essentially at the same time.
The additional ionization is especially important in the D region. HF radio waves normally pass through this lower region before being refracted at higher altitudes. During a strong flare, increased collisions between electrons and neutral particles remove more energy from the radio wave.
The result can range from mild weakening to almost complete absorption.
NOAA: Solar Flares and Radio Blackouts
Where Is a Flare Blackout Strongest?
The direct flare effect is generally strongest:
- On the sunlit side of Earth
- Where the Sun is relatively high above the horizon
- On HF paths crossing the illuminated region
- At frequencies where absorption exceeds the available link margin
The night side is not exposed to the same prompt X-ray illumination. A dayside path may therefore fail while a geographically different path remains usable.
Which HF Frequencies Are Most Vulnerable?
HF conventionally covers approximately 3–30 MHz. Lower HF frequencies generally experience more D-region absorption than higher HF frequencies under the same conditions.
However, “move higher” is not a universal solution.
A higher frequency may experience less absorption but still fail if it is above the maximum frequency that the upper ionosphere can refract along that path. A usable frequency must satisfy two conditions:
- It must be high enough to avoid excessive lower-ionosphere absorption.
- It must remain low enough to be supported by the upper-ionosphere path.
NOAA’s D-Region Absorption Prediction product helps users estimate where absorption is occurring and which frequencies are likely to be affected.
NOAA: D-Region Absorption Predictions
How Do Solar Radiation Storms Affect Polar Communication?
Solar radiation storms can disrupt high-latitude HF communication when energetic protons enter Earth’s polar atmosphere and increase lower-ionosphere ionization.
Earth’s magnetic field guides many charged particles toward the north and south polar regions. There, the particles collide with atmospheric molecules and can create an absorbing layer along polar communication routes.
This effect is commonly called polar-cap absorption.
It matters most for:
- Transpolar airline routes
- Arctic and Antarctic operations
- High-latitude maritime communication
- Government and research stations
- Long-distance amateur-radio paths crossing polar regions
Unlike the prompt electromagnetic effect of a solar flare, an energetic-particle event may affect communication for hours or longer. NOAA notes that solar radiation storms themselves can last from hours to days, although the radio impact depends on particle energy, latitude, frequency, path geometry, darkness, and current ionospheric conditions.
Why Can a Lower-Latitude Route Work Better?
A polar route may be geographically short but radio-electrically poor during strong particle absorption.
A longer route at a lower geomagnetic latitude may avoid the region of greatest absorption. That alternative may require:
- A different HF frequency
- A relay station
- Another satellite
- A terrestrial network
- Additional signal margin
- More operating capacity
Rerouting reduces dependence on the disturbed region. It does not guarantee that the replacement path will remain unaffected.
How Do Geomagnetic Storms Change HF Propagation?
Geomagnetic storms can reorganize the upper ionosphere, changing the frequencies, ranges, and geographic paths supported by HF communication.
A geomagnetic storm occurs when energy from disturbed solar wind is transferred into Earth’s magnetosphere. The resulting currents, particle precipitation, and heating alter ionospheric density and structure.
The effects are usually complicated rather than uniform. Electron density may fall in one region, rise in another, or change rapidly as the storm develops.
Operators may observe:
- A lower maximum usable frequency
- A temporarily higher usable frequency on another path
- Shorter or longer skip distances
- Rapid fading
- Auroral flutter or distortion
- Weakening of high-latitude paths
- Unexpected long-distance openings
- A path that appears and disappears within a short period
The NOAA G scale describes the overall severity of a geomagnetic storm, but a G-scale level alone cannot predict the exact performance of an individual radio circuit.
Should You Move Higher or Lower in Frequency?
The correct direction depends on the dominant mechanism.
| Observed condition | Likely mechanism | Adjustment worth testing |
|---|---|---|
| Sudden daytime HF loss during a flare | Lower-ionosphere absorption | Try a higher frequency that remains usable for the path |
| A normally reliable high frequency no longer returns to Earth | Reduced upper-ionosphere support | Try a lower frequency |
| Severe degradation on a polar route | Particle or auroral absorption | Try a higher usable frequency, a lower-latitude path, or another system |
| Rapid satellite fading or repeated loss of lock | Ionospheric scintillation | Try another satellite, site, antenna, or supported band |
| Noise affects only one building or receiver | Local interference or equipment fault | Diagnose the station before changing the propagation plan |
Do not change frequency based on a space-weather alert alone. First identify whether the likely problem is lower-ionosphere absorption, loss of upper-ionosphere support, polar absorption, solar radio noise, or satellite-path scintillation.
How Does Space Weather Affect Satellite Communication?
Satellite communication can be affected when the ionosphere changes signal amplitude, phase, delay, polarization, or direction.
A signal traveling between a satellite and a ground terminal must cross the ionosphere. NOAA identifies several relevant effects:
- Group delay
- Phase advance
- Absorption
- Refraction
- Scintillation
- Temporary loss of communication during severe conditions
NOAA: Satellite Communications
These effects are frequency-dependent. Lower-frequency satellite services are generally more sensitive to ionospheric delay, refraction, and polarization changes than higher-frequency services.
That comparison applies only to ionospheric propagation effects. It does not mean that every higher-frequency link is more reliable overall. Microwave systems may also face rain attenuation, antenna-pointing errors, equipment faults, congestion, and other problems unrelated to space weather.
What Is Ionospheric Scintillation?
Ionospheric scintillation is a rapid fluctuation in the amplitude or phase of a radio signal caused by small-scale variations in ionospheric electron density.
Different portions of the signal are refracted or scattered along slightly different paths. When those components reach the receiver, they may reinforce or cancel one another.
Possible symptoms include:
- Fast amplitude fading
- Rapid phase variation
- Lower carrier-to-noise ratio
- Tracking-loop stress
- Packet or data loss
- Intermittent loss of receiver lock
Scintillation is more common at equatorial and high latitudes than at many mid-latitude locations. Its occurrence also depends on local time, season, geomagnetic activity, solar-cycle conditions, and processes originating below the ionosphere.
NOAA: Ionospheric Scintillation
Are Higher-Frequency Satellite Links Immune?
No.
Higher-frequency satellite links are often less sensitive to ionospheric delay and large-scale refraction than lower-frequency links, but they are not immune to scintillation or other propagation effects.
The current in-force version of ITU-R Recommendation P.531 provides methods for evaluating ionospheric effects on Earth-to-space paths. Its scope includes frequencies from 0.1 to 12 GHz, while emphasizing that the importance of each effect depends on the application, location, frequency, path, and natural variability of the ionosphere.
ITU-R P.531-16: Ionospheric Propagation Data and Prediction Methods
Which Radio Services Are Most Vulnerable?
| Radio service | Relationship with the ionosphere | Main space-weather concern | Editorial relative vulnerability |
|---|---|---|---|
| Long-distance HF communication | Depends on ionospheric refraction | D-region absorption, upper-ionosphere changes, and auroral disturbance | High |
| Polar aviation HF | Uses high-latitude ionospheric paths | Energetic-particle and auroral absorption | High during relevant events |
| Maritime HF | May depend on long oceanic skywave paths | Flare absorption and geomagnetic propagation changes | Moderate to high |
| Amateur HF radio | Frequently uses variable ionospheric paths | Multiple flare, particle, and geomagnetic mechanisms | High but path-dependent |
| VHF/UHF satellite communication | Passes through the ionosphere | Scintillation, delay, refraction, and polarization change | Moderate |
| GNSS reception | Uses weak satellite signals and precise timing | Scintillation, delay, and electron-density gradients | Moderate to high in affected regions |
| Microwave satellite communication | Crosses the ionosphere at higher frequencies | Scintillation and severe trans-ionospheric disturbance | Usually less sensitive to ionospheric delay and refraction than lower-frequency links |
| Local terrestrial VHF/UHF | Normally remains below the ionosphere | Limited direct effect; possible indirect infrastructure consequences | Usually low |
The ratings in this table are editorial comparisons, not standardized NOAA or ITU severity classifications. Actual vulnerability depends on frequency, path geometry, latitude, local time, equipment, signal margin, modulation, coding, and current ionospheric conditions.
The microwave comparison concerns ionospheric propagation only. It excludes rain attenuation, satellite hardware radiation effects, ground-station failures, antenna problems, and network congestion.
How Can You Diagnose a Suspected Space-Weather Radio Problem?
A useful diagnosis should connect four facts: the event, path, band, and symptom.
This article calls that process the EPBS Radio Impact Check.
EPBS is an original editorial tool that turns established space-weather principles into a repeatable troubleshooting sequence. It is not an official NOAA, NASA, or ITU classification.
1. Event: What Is Happening?
Check authoritative sources for:
- An R-scale radio blackout
- An S-scale solar radiation storm
- A G-scale geomagnetic storm
- Elevated D-region absorption
- A reported solar radio burst
- Ionospheric scintillation
- Unusual total electron content or plasma conditions
Avoid using one index to explain every failure. For example, Kp describes geomagnetic disturbance but does not directly measure prompt X-ray absorption from a flare.
2. Path: Where Does the Signal Travel?
Determine whether the path:
- Crosses Earth’s sunlit side
- Enters a polar or auroral region
- Runs between a satellite and Earth
- Remains entirely within the lower atmosphere
- Passes close to the apparent direction of the Sun
- Uses one region while an unaffected comparison path uses another
Geography is often the fastest way to reject an incorrect explanation.
A flare-driven dayside blackout should not produce the same prompt D-region effect on a path that remains entirely in darkness.
3. Band: Which Frequency Is Being Used?
Record the operating frequency rather than describing the system only as “shortwave” or “satellite radio.”
The likely mechanism changes with frequency:
- HF skywave is strongly dependent on the ionosphere.
- Local VHF and UHF links usually do not rely on ionospheric refraction.
- Satellite VHF, UHF, and microwave signals cross the ionosphere.
- Lower-frequency signals generally experience greater ionospheric delay and refraction.
- A solar radio burst creates the greatest direct interference where its emission overlaps the receiver’s band.
4. Symptom: What Does the Failure Look Like?
| Symptom | Mechanism worth investigating |
|---|---|
| Several distant HF signals weaken almost simultaneously during local daytime | Flare-driven D-region absorption |
| Only polar or high-latitude HF routes deteriorate | Energetic-particle or auroral absorption |
| Skip distance and usable HF bands change over several hours | Upper-ionosphere disturbance |
| Satellite strength or phase fluctuates rapidly | Ionospheric scintillation |
| Received noise rises while the wanted signal remains present | Solar or local radio-frequency noise |
| Only one receiver, cable, or antenna fails | Local equipment failure is more likely |
| A local VHF repeater loses coverage in one direction | Terrain, antenna, feed-line, power, or local interference is more likely |
The four EPBS answers should form one physically consistent explanation. If the event, path, band, and symptom do not agree, continue troubleshooting before attributing the problem to space weather.
Operational Check
During a suspected radio disruption, check:
- Current NOAA R, S, and G levels.
- NOAA D-RAP for dayside or polar absorption.
- Your own path, frequency, receiver evidence, and local equipment status.
NOAA Space Weather Prediction Center
How Does EPBS Work in a Documented Event?
Worked Example: The March 30, 2026 R3 Radio Blackout (UTC)
NOAA reported that an X1.4 solar flare peaked at 03:19 UTC on March 30, 2026, producing an R3 Strong radio blackout on Earth’s sunlit side.
NOAA’s D-Region Absorption Prediction modeling indicated wide-area HF degradation centered over the Maritime Continent, including Southeast Asia and northern Australia.
The NOAA page title refers to the event as occurring “late on 29 Mar” because of the time zone used in the headline. This article uses UTC consistently.
Here is how the EPBS framework would assess a reported HF failure during that event.
Event
A documented R3 radio blackout was occurring. That supports a flare-driven lower-ionosphere absorption mechanism.
Path
The most credible affected path would cross the sunlit region identified by the D-RAP model. A path on the dark side would require another or additional explanation.
Band
HF communication would be the primary concern. Lower HF frequencies would generally face greater absorption, although the result would depend on the complete path.
Symptom
A credible symptom would be the rapid weakening of several distant HF signals rather than failure of only one receiver, feed line, or antenna.
Local Checks
Before assigning the cause, an operator should still confirm:
- Power-supply status
- Antenna and feed-line condition
- Receiver configuration
- Local interference
- Whether comparison stations reported similar degradation
Likely Interpretation
If the event, geographic path, HF band, and broad signal loss all aligned, flare-enhanced D-region absorption would be a strong explanation.
Appropriate Response
An operator could test a higher HF frequency that remained below the path’s current maximum usable frequency, use a geographically different route, or switch to an approved backup network.
Important Limitation
NOAA’s event record verifies the flare, R3 classification, and modeled affected region. It does not prove that every station in Southeast Asia or northern Australia lost communication.
This article does not claim station-specific measurements that were not documented. An authoritative regional warning supports a diagnosis, but it does not replace observations from the individual radio link.
What Should You Do When Radio Conditions Deteriorate?
Step 1: Confirm the Local System
Check ordinary causes first:
- Receiver and transmitter settings
- Antenna connections
- Feed line and connectors
- Power supply
- Local interference
- Network or transmitter maintenance
- Physical obstruction
- Known satellite or repeater outages
A real space-weather event can occur at the same time as an unrelated equipment failure.
Step 2: Compare an Independent Path
Test one or more alternatives:
- Another frequency
- Another antenna
- Another receiver
- Another ground station
- Another satellite
- Another geographic route
- A terrestrial backup network
A regional propagation problem should affect paths according to their geometry rather than disabling every communication method identically.
Step 3: Check Operational Space-Weather Products
Useful NOAA resources include:
- Current R, S, and G scale levels
- Three-day forecasts
- Radio-blackout alerts
- D-Region Absorption Prediction maps
- Solar proton alerts
- Geomagnetic observations
- Total electron content products
- The Geophysical Alert message for HF users
These products describe environmental conditions and expected impacts. They cannot guarantee whether one individual link will work.
Step 4: Match the Response to the Mechanism
- Flare-driven lower-ionosphere absorption: Test a higher usable HF frequency.
- Loss of upper-ionosphere support: Test a lower frequency.
- Polar absorption: Use a lower-latitude route or another communication system.
- Satellite scintillation: Try another satellite, site, antenna, supported band, or terrestrial path.
- Solar radio noise: Change geometry, timing, antenna direction, or frequency when operationally permitted.
- Uncertain cause: Preserve multiple options and continue diagnosis.
Step 5: Record the Event
Record:
- Start and end time in UTC
- Frequency and operating mode
- Transmitting and receiving locations
- Satellite or network used
- Approximate signal-strength change
- Signal-quality or receiver-lock indicators
- Relevant NOAA alert levels
- D-RAP or other operational products
- Local equipment checks
- Adjustments that succeeded or failed
A consistent record is more useful than memory when comparing future events.
How Much Can Additional Absorption Change a Radio Link?
Consider a simplified HF link with an 8 dB margin above the minimum signal level needed for reliable communication.
If ionospheric absorption increases by 6 dB, the received-power ratio becomes:
P₂ ÷ P₁ = 10^(−6/10) ≈ 0.25
The receiver now obtains approximately one-quarter of the previous signal power.
The original 8 dB margin would be reduced to about 2 dB. The link might remain usable under steady, low-noise conditions, but normal fading could push it below the required threshold.
If absorption increases by 10 dB:
P₂ ÷ P₁ = 10^(−10/10) = 0.10
Only one-tenth of the previous signal power remains. A link that began with 8 dB of margin would now be approximately 2 dB below its required level.
This is an illustrative calculation, not an observation from a particular station. Actual performance also depends on:
- Receiver noise
- External noise
- Fading
- Antenna gain
- Polarization
- Modulation
- Error correction
- Required data rate
- Interference
- The complete propagation path
The example shows why a change that sounds small in decibels can determine whether a marginal link remains usable.
Which Mitigation Option Fits Which Problem?
| Mitigation | Most useful when | Main advantage | Main limitation |
|---|---|---|---|
| Change HF frequency | The original frequency is excessively absorbed or no longer supported | Fast and may require no new hardware | Moving in the wrong direction can make the link worse |
| Change geographic route | A polar, auroral, or dayside region is disturbed | Avoids the most affected area | May require relays or additional capacity |
| Use another satellite | One satellite path crosses disturbed plasma | Provides spatial diversity | The replacement path may cross a similar region |
| Switch to terrestrial communication | HF or satellite propagation is unreliable | Avoids the affected propagation mode | Infrastructure may not be available |
| Reduce data rate or strengthen coding | A weak signal remains detectable | Improves tolerance to fading and errors | Reduces throughput and cannot overcome complete absorption |
| Use antenna or site diversity | Fading differs across location or geometry | Reduces dependence on one signal path | Requires additional equipment and coordination |
| Delay nonessential traffic | The disturbance is temporary | Avoids repeated failed transmissions | Unsuitable for urgent or safety-critical traffic |
No individual technique makes a radio system “space-weather proof.”
Resilience comes from diversity: multiple frequencies, paths, sites, satellites, networks, power sources, and approved operating procedures.
What Common Mistakes Lead to the Wrong Diagnosis?
Treating Every Solar Event as the Same Event
A solar flare, coronal mass ejection, solar radiation storm, geomagnetic storm, and solar radio burst may be related, but they are not interchangeable.
They reach or affect Earth through different physical processes and produce different communication symptoms.
Assuming Kp Explains Every Radio Failure
Kp describes planetary geomagnetic activity. It does not directly measure prompt dayside D-region absorption produced by solar-flare radiation.
Automatically Moving to a Higher Frequency
Higher HF frequencies often experience less D-region absorption, but they may not return to Earth if the upper ionosphere cannot support them.
During a depleted upper ionosphere, moving lower may be the correct choice.
Increasing Power Without Checking the Path
Additional power may help a link with moderate attenuation and available propagation support. It may not restore a path that is severely absorbed or no longer reaches the intended area.
Blaming Space Weather Before Checking the Station
A failed cable, damaged antenna, incorrect setting, local noise source, obstructed satellite view, or power problem is usually more specific evidence than a general space-weather alert.
Confusing Space Weather With Rain Fade
Rain attenuation affects many microwave links in the lower atmosphere. It is terrestrial weather, not an ionospheric space-weather effect.
Treating a Forecast as a Guarantee
A forecast gives probabilities and expected environmental conditions. It does not specify the exact link margin, antenna pattern, local noise, or receiver performance of an individual system.
What Should Different Users Do Next?
Amateur Radio Operators
Maintain a practical plan across several HF bands rather than relying on one preferred frequency. Compare daytime and nighttime paths, monitor D-RAP during flare activity, and record which bands work under different conditions.
Emergency Communication Teams
Test backup systems before they are needed. Avoid depending entirely on one HF band, repeater, satellite provider, internet connection, or power source.
Document the changeover procedure so that backup operation does not depend on one person’s memory.
Aviation and Maritime Users
Follow approved operational guidance, dispatch procedures, and safety requirements. Space-weather information should complement—not replace—official route, communication, and contingency decisions.
Satellite and GNSS Users
Monitor receiver-level evidence such as:
- Carrier-to-noise ratio
- Loss-of-lock events
- Phase stability
- Packet-error rate
- Satellite geometry
- Performance at different sites
Direct link measurements are usually more useful than a general geomagnetic index when diagnosing one specific terminal.
Infrastructure Managers
Identify which critical processes depend on:
- HF communication
- Satellite links
- GNSS timing
- Remote telemetry
- Internet-connected ground stations
- Commercial power
The most effective mitigation may be operational redundancy rather than a change to the radio itself.
What This Article Does Not Claim
This article does not claim that:
- Every radio failure during solar activity is caused by space weather.
- Every geomagnetic storm disrupts communication.
- A NOAA alert guarantees an outage on a particular link.
- One frequency adjustment restores every HF path.
- Higher-frequency satellite links are immune to ionospheric effects.
- More transmitter power can overcome every blackout.
- Consumer equipment can replace required aviation, maritime, or emergency systems.
- Forecasts eliminate uncertainty in ionospheric propagation.
- The EPBS framework is an official government standard.
- The link-budget example represents measured performance from a real station.
- The historical case proves how every radio system behaved in the affected region.
Radio performance results from the interaction of the environment, signal path, equipment, network design, and operational requirements.
What Is the Practical Conclusion?
Space weather does not affect every radio system in the same way.
Solar flares can rapidly absorb dayside HF signals. Energetic particles can degrade polar communication. Geomagnetic storms can change the upper ionosphere and move the frequencies or paths that HF systems can support. Plasma irregularities can make satellite and GNSS signals fluctuate or lose lock.
The most reliable diagnosis begins with four questions:
- What event is occurring?
- Where does the signal path travel?
- Which frequency is being used?
- What does the failure actually look like?
Occasional users should begin by learning the difference between NOAA’s R, S, and G scales. Regular operators should maintain more than one frequency or network and keep UTC-based performance records. Safety-critical organizations should build communication diversity into approved plans before an event occurs.
Frequently Asked Questions
Can a solar flare disable all radio communication worldwide?
No. A flare-driven blackout primarily affects HF communication on Earth’s sunlit side. The impact depends on flare intensity, frequency, path geometry, and available link margin.
Local terrestrial radio and many higher-frequency systems may continue operating.
How long can a radio blackout last?
There is no single duration.
Flare-related absorption may be brief or continue through a longer X-ray event. Particle-driven polar absorption can persist much longer. Current NOAA products are more useful than assuming a standard duration.
Does a geomagnetic storm always make amateur radio worse?
No.
Geomagnetic storms often make propagation unstable, especially at high latitudes, but one path may weaken while another becomes temporarily usable. The result depends on location, time, frequency, and storm phase.
Can space weather affect VHF and UHF communication?
Yes, but the path matters.
Local terrestrial VHF and UHF systems usually remain below the ionosphere and are less directly exposed. VHF and UHF satellite signals cross the ionosphere and may experience delay, refraction, polarization changes, or scintillation.
Why can one radio path fail while another still works?
The paths may cross different parts of the ionosphere, use different frequencies, or begin with different signal margins.
One path may cross a sunlit, polar, or auroral region while another avoids it.
Can more transmitter power overcome a space-weather blackout?
Sometimes additional link margin helps during moderate attenuation. It cannot reliably restore a severely absorbed path or one that the ionosphere no longer supports.
Frequency, route, site, satellite, and network diversity are usually more dependable than relying only on additional power.
Sources
- NOAA Space Weather Prediction Center: Solar Flares and Radio Blackouts
- NOAA Space Weather Prediction Center: HF Radio Communications
- NOAA Space Weather Prediction Center: D-Region Absorption Predictions
- NOAA Space Weather Prediction Center: NOAA Space Weather Scales
- NOAA Space Weather Prediction Center: Solar Radiation Storms
- NOAA Space Weather Prediction Center: Geomagnetic Storms
- NOAA Space Weather Prediction Center: Ionospheric Scintillation
- NOAA Space Weather Prediction Center: Satellite Communications
- NOAA Space Weather Prediction Center: R3 Event Late on 29 Mar
- NASA Science: 10 Things to Know About the Ionosphere
- ITU-R P.531-16: Ionospheric Propagation Data and Prediction Methods
Sources and Editorial Approach
This article was checked against NOAA operational explanations, NASA educational material, and the in-force ITU-R Recommendation P.531-16.
The following elements are original editorial tools rather than official government classifications or original observational data:
- The EPBS Radio Impact Check
- The editorial relative-vulnerability comparison
- The troubleshooting matrix
- The mitigation comparison
- The illustrative 6 dB and 10 dB link-margin calculations
The March 30, 2026 example uses a documented NOAA event. The article does not add unverified station reports or claim that the author personally measured its effects.
This guide is based on published specifications, authoritative documentation, and practical diagnostic criteria rather than hands-on product testing, proprietary monitoring data, or unpublished experiments.
Source links and technical claims were reviewed on August 3, 2026. The review date should only be changed after a substantive factual review.
More from Technology & Infrastructure Impacts
Can Solar Storms Damage Phones, Cars, or Home Electronics?
Solar storms are unlikely to directly destroy phones, disable passenger cars, or fry unplugged home electronics at ground level. The more realistic risks are indirect: degraded GPS accuracy, interrupted satellite or cellular services, power-grid disturbances, unavailable EV chargers, fuel-pump outages, and ordinary electrical problems during power restoration. This article explains why long, grounded infrastructure is more vulnerable to geomagnetically induced currents than compact consumer devices. It also separates solar flares, radiation storms, coronal mass ejections, and geomagnetic storms so readers can understand which technology effects belong to each event. Using the original Scale–Path–Dependency–Recovery framework, risk matrices, a May 2024 storm case study, troubleshooting guidance, and user-specific preparation advice, the guide helps households evaluate realistic exposure without fear-based claims. It also covers surge-protection limits, medical-equipment planning, offline navigation, EV charging, and safe outage preparation based on authoritative NOAA, NASA, USGS, NIST, Department of Energy, and Ready.gov guidance.
Can a Geomagnetic Storm Disrupt the Power Grid?
A geomagnetic storm can disrupt the power grid by creating geoelectric fields that drive geomagnetically induced currents through long, grounded transmission networks. This article explains how those currents can push transformers into part-cycle saturation, increase reactive-power demand, produce harmonics, trigger protective equipment, and—under severe conditions—contribute to voltage instability or a regional blackout. It also shows why a NOAA G5 rating does not automatically predict a local power failure. Using an original Four-Gate Grid Disruption Framework, a simplified voltage calculation, and a balanced comparison of the March 1989 Québec blackout and the May 2024 Gannon Storm, the guide examines how geology, line orientation, transformer design, system loading, and operator preparation shape the outcome. Readers will also find practical outage-preparation guidance for households, medical-device users, businesses, solar-and-battery owners, and critical facilities, supported by authoritative NOAA, USGS, NERC, DOE, Hydro-Québec, and Ready.gov sources.
Can Solar Storms Damage Satellites?
Solar storms can disrupt satellites and, under unfavorable conditions, cause permanent hardware damage or mission loss. This article explains how energetic particles can upset electronics, how surface and internal charging may trigger electrical discharges, and why geomagnetic storms increase atmospheric drag on satellites in low Earth orbit. It also compares risks across low, medium, geostationary, polar, and deep-space orbits. Using the February 2022 Starlink losses as a documented example, the guide shows why orbit, spacecraft design, mission phase, storm duration, and recovery capability matter more than a storm rating alone. Readers will also find an illustrative drag calculation, an orbit-based risk table, the original ORBIT comparison framework, a pre-storm readiness checklist, and a practical anomaly-investigation process. The article draws on NASA, NOAA, ESA, and peer-reviewed sources while clearly distinguishing general education from mission-specific engineering advice.
Explore More Topics

How to Photograph the Northern Lights
Photographing the Northern Lights requires more than choosing one fixed camera setting. This practical guide explains how to select a camera and lens, focus accurately on stars, stabilize your equipment, and adjust shutter speed, aperture, and ISO according to the aurora’s brightness and movement. It includes starting settings for fast, moderate, and faint displays, along with a Motion–Brightness–Foreground framework that helps photographers make better decisions as conditions change. Readers will also learn how to use a smartphone Night mode, compose a stronger foreground, protect color-channel highlights, edit images responsibly, and disclose exposure blends clearly. A quick-reference card, three-frame comparison method, packing checklist, safety guidance, and detailed troubleshooting table make the article useful in the field. The guide relies on published guidance from NASA, NOAA, Nikon, Canon, and Apple while clearly distinguishing authoritative information from adjustable photography recommendations.
How Far South Can the Northern Lights Be Seen?
The northern lights usually remain within high-latitude regions, but powerful geomagnetic storms can carry visible aurora surprisingly far south. This guide explains why there is no single worldwide southern boundary and shows how geomagnetic latitude, the auroral oval, Kp, storm intensity, emission altitude, darkness, cloud cover, and local light pollution affect what an observer may see. It examines NOAA’s generalized U.S. visibility examples for G1 through G5 storms, while clarifying that locations such as Alabama, Florida, and southern Texas represent rare historical possibilities rather than guaranteed forecast limits. Readers will also find an original four-gate decision framework, an auditable geometric viewing-distance example, regional viewing guidance, a practical checklist, and troubleshooting advice for distinguishing faint aurora from clouds or artificial sky glow. The article helps observers decide when a forecast justifies going outside or traveling to a safer, darker viewing site.
What Are the Best Conditions for Seeing the Northern Lights?
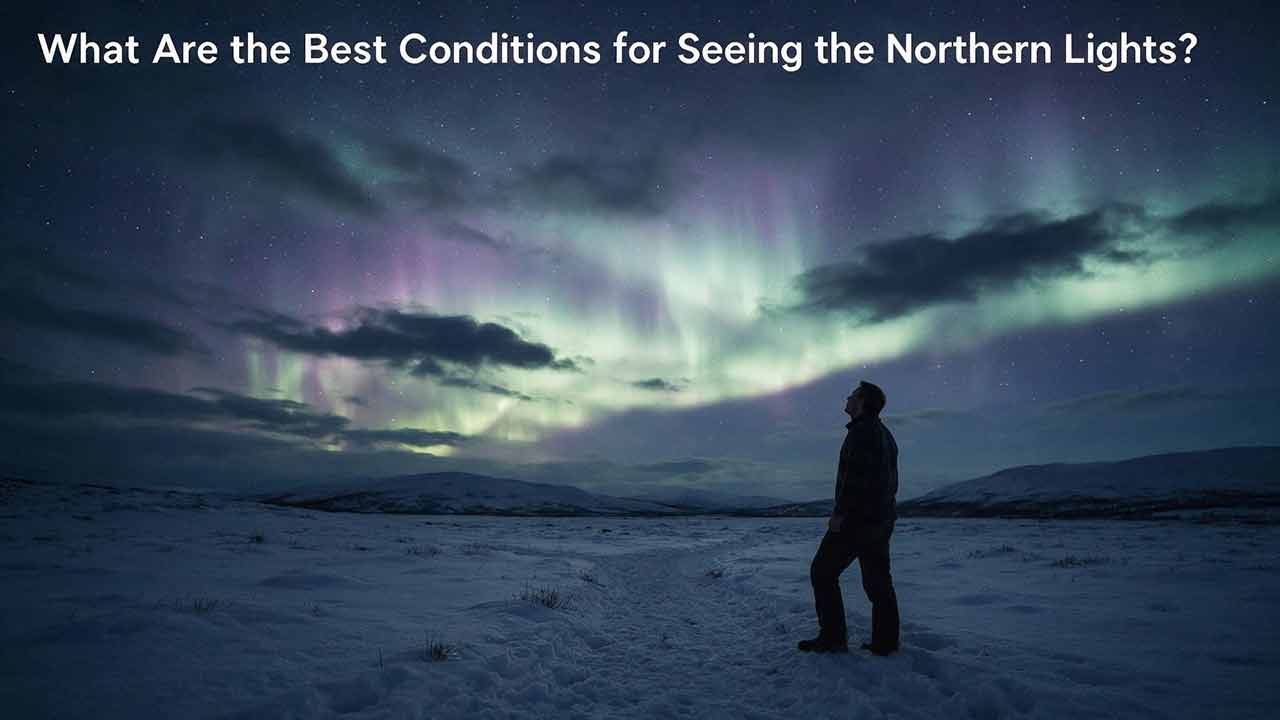
The best Northern Lights viewing conditions occur when geomagnetic activity, clear weather, darkness, and a suitable observing location align. This guide explains why the position of the auroral oval matters more than relying on a single Kp value and shows how cloud cover, twilight, light pollution, moonlight, atmospheric transparency, and horizon visibility affect what an observer can see. It introduces the Five-Gate Aurora Viewing Framework, a practical planning tool that evaluates aurora activity, clouds, darkness, location, and available viewing time without presenting the result as a guaranteed probability. Readers will also learn how to compare short- and long-range forecasts, convert UTC forecast periods, choose a safe dark-sky site, recognize faint aurora, and troubleshoot a promising forecast that produces no visible display. The article is based on guidance from NOAA, NASA, the University of Alaska Fairbanks, and the National Park Service.