How Reliable Are Aurora Forecast Apps?

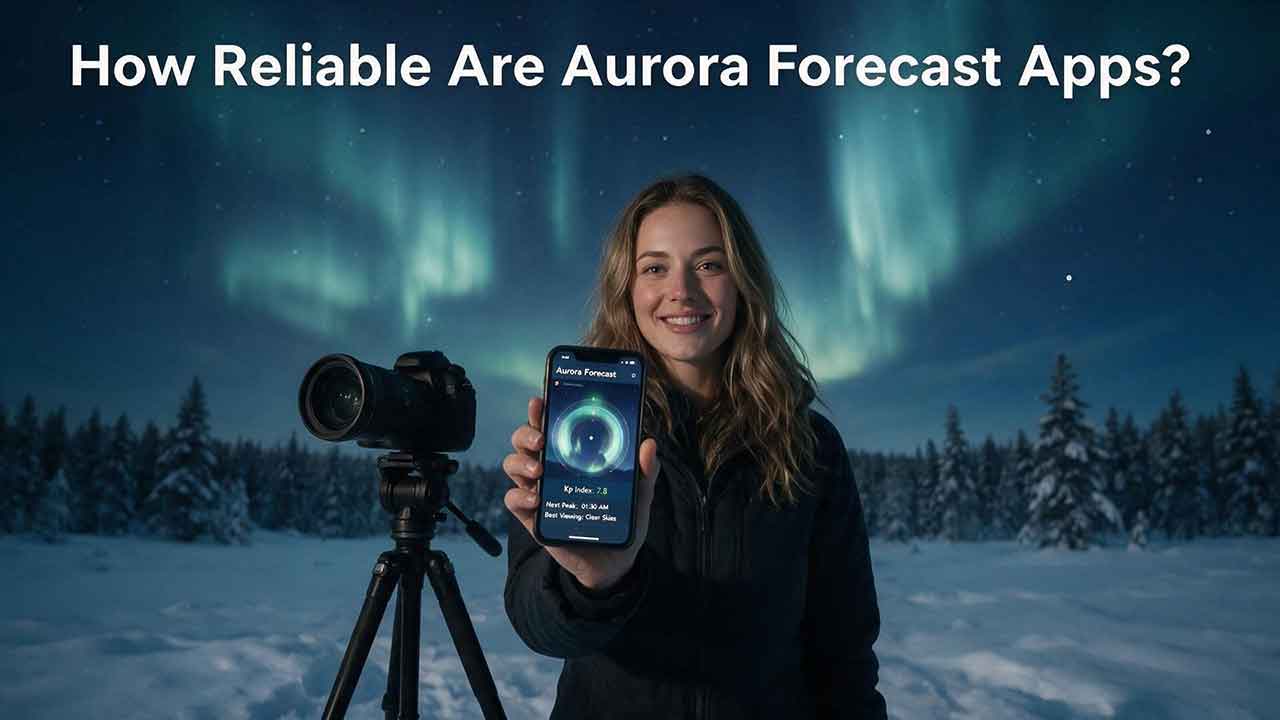
How Reliable Are Aurora Forecast Apps?
Aurora forecast apps are reliable enough to warn you that conditions may become favorable, but not reliable enough to guarantee a sighting at an exact location or time. Their value improves close to the event, especially when a current auroral-oval forecast is combined with cloud cover, darkness, an open horizon, official space-weather updates, and recent local observations.
Key Takeaways
- Aurora apps are better at identifying elevated regional activity than predicting exactly what one person will see.
- Forecasts issued several days ahead are preparation signals, not promises.
- NOAA’s short-range aurora product normally provides about 30–90 minutes of lead time when usable upstream solar-wind data are available.
- Kp, auroral-oval position, cloud cover, darkness, data age, and horizon quality must be considered together.
- Percentages from different apps may measure different things and should not be compared without reading their definitions.
This article explains what aurora forecast apps can predict, why their alerts disagree, how to check whether an alert is actionable, and how to audit an app’s performance without inventing an accuracy percentage.
This guide is based on official documentation, published research, and transparent evaluation criteria rather than hands-on testing of commercial apps. It does not rank products or claim that one app is universally the most accurate.
Who Is This Guide For?
This guide is for:
- casual skywatchers deciding whether to step outside;
- travelers planning a northern lights trip;
- photographers monitoring short viewing windows;
- lower-latitude observers who may need stronger evidence before traveling;
- and readers trying to understand conflicting alerts from different apps.
It is not a commercial app review, a product endorsement, or a guarantee that following a forecast will produce a sighting.
How Reliable Are Aurora Forecast Apps in Practice?
Aurora forecast apps are useful decision-support tools, but their reliability depends on the question being asked.
An app may correctly recognize that geomagnetic activity is elevated while still being wrong about the best viewing hour, the equatorward edge of visibility, local cloud conditions, or whether an observer will see color with the unaided eye.
That distinction matters because an “aurora forecast” can refer to several separate predictions.
| Question | Practical reliability | Main limitation |
|---|---|---|
| Is geomagnetic activity likely to increase within several days? | Useful for early awareness | Arrival time and storm strength may change |
| Is the auroral oval expanding now? | Useful for short-range monitoring | It does not account for every local viewing condition |
| Is my region near a possible visibility zone? | Useful as a regional guide | Forecast boundaries are not hard visibility lines |
| Will I see aurora from my address at a specific minute? | Limited | Local weather and rapid auroral changes dominate |
| Is an alert worth investigating? | Often useful | Independent verification is still needed |
| Is a sighting guaranteed? | No | Natural visibility cannot be guaranteed |
The most defensible conclusion is therefore:
An aurora app can tell you when conditions deserve attention. It cannot reliably promise what your sky will look like.
What Does “Reliable” Mean for an Aurora App?
Reliability should be divided into five separate abilities rather than compressed into one score.
Can the App Detect Elevated Activity?
A useful app should recognize when observed or forecast geomagnetic conditions are increasing.
Many apps obtain their underlying data from national forecasting agencies, scientific models, magnetometer networks, or solar-wind measurements. The app’s reliability then depends on how quickly it retrieves the data, whether it labels the data correctly, and how it translates those inputs into an alert.
Can the App Predict the Timing?
Timing is one of the hardest parts of aurora forecasting.
Several days before a possible geomagnetic storm, forecasters may know that a coronal mass ejection, or CME, is moving generally toward Earth. They may not yet know precisely when it will arrive, whether Earth will receive the center or edge of the disturbance, or how favorable its magnetic orientation will be.
NASA’s CCMC Earth CME Scoreboard compares submitted CME arrival predictions with observed arrivals. The scoreboard is a research-based, pre-event forecast-validation platform; it is not the official operational U.S. forecast. U.S. operational space-weather forecasts should be checked through the NOAA Space Weather Prediction Center.
This distinction helps explain why apps may change their predicted storm timing as an event approaches.
Can the App Place the Aurora Geographically?
Apps can use an auroral model to estimate where activity is likely to occur, but a modeled oval is not a rigid boundary.
NOAA’s Aurora 30-Minute Forecast states that bright aurora may sometimes be observed from as far as approximately 1,000 kilometers away when viewing conditions are favorable. An observer outside the area shown as directly under the oval may therefore see activity low on the poleward horizon.
The reverse is also possible: being inside a broad forecast zone does not guarantee that a display will be bright, sustained, unobstructed, or visible through cloud.
Can the App Predict Local Visibility?
This is usually the weakest part of the forecast chain.
A space-weather model does not automatically know about:
- a low bank of cloud over your viewing site;
- fog or blowing snow;
- lingering twilight;
- nearby streetlights;
- mountains, trees, or buildings;
- a blocked northern or southern horizon;
- private-property restrictions;
- or whether the display will be bright enough for naked-eye color.
NOAA’s aurora-viewing guidance identifies geomagnetic activity, location, darkness, and timing as major viewing factors. Local weather services must be used to evaluate cloud, fog, precipitation, wind, and road conditions.
Can the App Deliver a Useful Alert?
An alert can be scientifically reasonable but operationally unhelpful.
A notification may arrive too early, after the most active interval, or without explaining whether it refers to a forecast, a threshold that has already been reached, or a broad maximum expected during the next day.
Notification quality depends on:
- the app’s alert rules;
- server update frequency;
- device battery restrictions;
- mobile-network availability;
- location permissions;
- time-zone conversion;
- and the threshold chosen by the user.
An app notification is therefore an interpretation of data, not direct evidence that aurora is visible outside.
Why Are Short-Range Aurora Forecasts More Useful?
Forecast uncertainty generally decreases as an event approaches because forecasters gain access to more current measurements.
Long-range information is valuable for preparation. Short-range information is more useful for deciding whether to go outside or begin a viewing trip.
NOAA’s Aurora 30-Minute Forecast uses the OVATION model and normally provides about 30–90 minutes of lead time. The exact lead time depends on how long the measured solar wind will take to travel from the L1 observation region to Earth.
NOAA explains that the model uses solar-wind velocity and the interplanetary magnetic field measured upstream of Earth. If usable upstream solar-wind data are unavailable or contaminated, the model may instead be driven by a current Kp estimate, in which case the normal forecast lead time is not available.
That limitation is easy to miss when an app displays only the map without the source documentation.
| Forecast horizon | Best use | Appropriate response |
|---|---|---|
| More than three days | General awareness | Keep plans flexible; do not make expensive decisions |
| 24–72 hours | Preparation | Watch official updates and local weather trends |
| 6–24 hours | Same-day planning | Compare several official inputs and candidate sites |
| 1–6 hours | Active monitoring | Check current solar wind, oval position, and reports |
| About 30–90 minutes | Short-range decision support | Decide whether conditions justify going outside |
| Current observations | Confirmation | Check the sky, trusted local reports, or live cameras |
A useful rule is:
Use long-range forecasts to prepare and short-range observations to decide.
Which Aurora Data Matters Most?
No single number can determine whether you will see the aurora. A trustworthy app should show several complementary measurements and clearly identify whether each value is observed, modeled, or forecast.
Auroral-Oval Nowcast
An auroral-oval nowcast estimates the location and intensity of current or near-term activity.
NOAA’s operational product is based on OVATION, an empirical auroral model. According to the official product documentation, the model uses upstream solar-wind speed and interplanetary magnetic-field measurements to estimate auroral precipitation and likely intensity.
The oval is more geographically useful than Kp alone, but it still cannot account for every cloud layer, obstruction, or local source of light pollution.
Observed and Forecast Kp
The planetary Kp index summarizes geomagnetic disturbance on a scale from 0 to 9.
NOAA’s Planetary K-index documentation explains that its estimated planetary Kp represents a three-hour interval and is derived from a network of ground-based magnetometers.
An app should clearly distinguish among:
- Observed Kp: Based on measurements already collected.
- Estimated current Kp: A near-real-time estimate for the current interval.
- Forecast Kp: A predicted value for a future three-hour interval.
- Maximum expected Kp: The highest value forecast within a broader period.
These values answer different questions. A maximum forecast for tomorrow should not be compared directly with the current observed Kp as though one must be wrong.
Kp is useful for broad geomagnetic context, but NOAA notes that relationships between Kp and auroral latitude are approximate averages rather than exact local boundaries.
Solar-Wind Speed
Higher solar-wind speed can help deliver more energy into Earth’s magnetic environment, but speed alone is not enough.
An app that treats fast solar wind as a guaranteed aurora signal is oversimplifying the process. Magnetic-field strength, orientation, density, pressure changes, duration, and the previous state of the magnetosphere also matter.
The Bz Component of the Interplanetary Magnetic Field
Bz describes the north-south component of the interplanetary magnetic field.
A sustained southward Bz generally supports more effective coupling between the solar wind and Earth’s magnetic field. However, Bz can change rapidly, and a brief negative reading is not a guarantee of immediate visible aurora.
Bz should be read as a time series, not as a permanent green or red switch.
Watches, Warnings, and Alerts
These terms are not interchangeable.
NOAA’s Planetary K-index page explains that:
- watches are issued for predicted future geomagnetic conditions;
- warnings are issued when specified K-index conditions are expected;
- alerts are issued when a threshold has been reached.
An app that displays “G2 alert” without showing whether the condition is forecast, expected soon, or already observed may cause unnecessary confusion.
Cloud Cover
Cloud can make a good space-weather forecast irrelevant for visual observing.
Check hourly cloud rather than a single daily weather icon. Where available, compare low, middle, and high cloud because a general cloud percentage may conceal the layer most likely to obstruct the sky.
The UK Met Office also emphasizes in its aurora guidance that visibility depends on terrestrial weather and darkness as well as space-weather activity.
Darkness
The aurora may be physically present without being visually detectable against daylight or strong twilight.
This is especially important at high latitudes during summer. Moonlight and artificial lighting do not stop the aurora from occurring, but they can reduce contrast and make a faint display harder to see.
Timestamp and Time Zone
Every important number should have a timestamp.
Before acting on an alert, confirm:
- when the observation was made;
- when the model was run;
- which forecast interval is displayed;
- whether the time is UTC or local;
- and whether the app has updated since the notification was sent.
A simple display with fresh data can be more useful than a sophisticated map that has not updated.
Why Do Different Aurora Apps Disagree?
Apps can disagree while all displaying technically valid information because they may be answering different questions.
They May Show Different Forecast Windows
One app may show the highest Kp forecast during the next 24 hours. Another may show the current estimated Kp. A third may show the expected value for the next three-hour interval.
Without checking the labels and timestamps, these values may appear contradictory.
They May Use Different Data Sources
Apps may use:
- NOAA products;
- ESA services;
- national geomagnetic forecasts;
- privately processed data;
- different weather providers;
- or a mixture of several sources.
Even when two apps use the same source, they may retrieve or cache it at different times.
They May Apply Different Alert Thresholds
A high-latitude app may notify users during activity that is routine in northern Scandinavia or Alaska. An app designed for lower-latitude observers may wait for a stronger expansion.
Location buffers, Kp thresholds, and notification sensitivity may also differ.
Their Percentages May Mean Different Things
A displayed percentage might refer to:
- modeled auroral intensity;
- proximity to the estimated oval;
- the probability of exceeding an internal threshold;
- a proprietary activity score;
- cloud-adjusted viewing conditions;
- or a combination of unrelated inputs.
Unless the app defines the number, “70%” should not be interpreted as a scientifically established 70% personal chance of seeing the aurora.
Percentages from different apps are not directly comparable unless their calculation methods and forecast windows are equivalent.
They May Use Different Weather Models
Cloud forecasts can differ substantially, particularly for fog, broken low cloud, coastal cloud, and fast-changing local conditions.
An app can use accurate space-weather data but still give poor viewing advice because its local weather layer is wrong.
Notifications May Be Delayed
An app’s server may generate an alert promptly while the phone displays it later because of battery optimization, weak connectivity, disabled background activity, or operating-system notification settings.
Always compare the notification time with the timestamp of the underlying data.
A Worked Example of Apparent App Disagreement
The following is an illustrative scenario, not a record of an actual product test.
Suppose three apps display these messages at 20:00 local time:
| App display | What it may actually mean |
|---|---|
| “Kp 6 expected” | The maximum value forecast later in the night |
| “Current Kp 3” | The estimated value for the present three-hour interval |
| “High aurora chance” | A proprietary score based on your location and a modeled oval |
All three displays could be internally consistent.
The disagreement becomes meaningful only after checking:
- the valid time of each forecast;
- whether the number is observed or predicted;
- the app’s data source;
- the definition of “chance”;
- and the latest auroral-oval and local-weather conditions.
This is why app reliability cannot be judged from screenshots alone.
The Signal-to-Sky Reliability Framework
The Signal-to-Sky Reliability Framework is an original editorial framework for organizing the recurring decision factors found in official space-weather documentation, local-weather guidance, and practical observing constraints.
It has not been validated as a scientific forecast model and does not produce a probability or accuracy percentage.
The framework contains five gates.
| Gate | Question | Evidence to check |
|---|---|---|
| Source | Can the information be traced to a credible provider? | Named agency, model, weather provider, or documented data feed |
| Freshness | Is the information current enough for the decision? | Observation time, model-run time, forecast interval |
| Space-weather signal | Is the activity relevant to this latitude? | Auroral oval, Kp, solar wind, Bz, official messages |
| Local sky | Can the atmosphere reveal the display? | Darkness, cloud, fog, precipitation, Moon, light pollution |
| Field confirmation | Is there evidence the forecast is producing visible results? | Local reports, all-sky cameras, test photographs, direct observation |
An alert becomes more actionable as it passes more gates.
A strong space-weather signal cannot pass the local-sky gate if the site is in daylight or beneath solid overcast. A clear, dark sky cannot compensate for an auroral oval that remains far poleward of the observer.
A Viewing-Constraint Comparison Tool
This unvalidated editorial tool is intended only for comparing candidate viewing locations during the same forecast window. It is not an aurora probability, scientific forecast model, or calibrated accuracy score.
Evaluate each factor as Strong, Moderate, Weak, or Blocking.
| Factor | Strong | Moderate | Weak | Blocking |
|---|---|---|---|---|
| Space-weather relevance | Location is under or near an active oval | Oval may become relevant | Activity remains far poleward | No meaningful regional signal |
| Cloud | Mostly clear | Broken cloud with useful gaps | Mostly cloudy | Solid overcast or dense fog |
| Darkness | Full astronomical darkness | Adequate darkness with some glow | Bright twilight or strong local light | Daylight |
| Horizon | Wide, unobstructed poleward view | Minor obstructions | Significant obstruction | No useful view in the required direction |
| Access and safety | Legal, safe, reachable | Some manageable constraints | Difficult conditions | Unsafe, closed, or illegal |
How to Use the Tool
- Compare locations only within the same forecast period.
- Treat any Blocking factor as a reason not to use that site.
- Prefer the location with the fewest Weak factors.
- Recheck cloud and access before departure.
- Do not convert the ratings into a percentage.
Illustrative Comparison
Suppose Site A has a darker sky but solid cloud, while Site B has moderate light pollution and large cloud breaks.
| Factor | Site A | Site B |
|---|---|---|
| Space-weather relevance | Strong | Strong |
| Cloud | Blocking | Moderate |
| Darkness | Strong | Moderate |
| Horizon | Strong | Strong |
| Access and safety | Strong | Strong |
Site B is the more practical choice because Site A’s cloud is a blocking constraint. This remains true even though Site A would otherwise be the darker location.
How Can You Audit an Aurora App’s Reliability?
Anecdotes such as “the app was right once” or “I saw nothing after an alert” are not enough to establish accuracy.
A more defensible approach is to keep a structured alert log.
Step 1: Define What You Are Testing
Choose one or more outcomes:
- Did the app correctly identify elevated regional activity?
- Did the alert arrive before the relevant activity window?
- Did the predicted timing overlap the observed event?
- Did the app correctly describe local viewing conditions?
- Was a display confirmed under suitably clear and dark conditions?
Do not combine all five questions into one vague “accurate” label.
Step 2: Record Every Eligible Alert
Do not record only successful nights. Selective logging creates survivorship bias.
Use a table such as this:
| Field | What to record |
|---|---|
| Alert ID | A unique number |
| Alert received | Date and UTC time |
| Location | City or approximate observing region |
| App statement | Exact claim or alert category |
| Forecast window | Start and end time |
| Displayed source | NOAA, ESA, another provider, or unspecified |
| Displayed Kp or oval status | Include whether observed or forecast |
| Official comparison | Relevant national forecast or model output |
| Cloud and darkness | Conditions during the forecast window |
| Local evidence | Observation, camera, trusted report, or no usable evidence |
| Activity result | Hit, miss, unclear, or not testable |
| Timing result | Useful, late, too early, or unclear |
| Local visibility result | Confirmed, not confirmed, or weather-blocked |
| Notes | Data delays, location changes, or app updates |
Step 3: Separate Weather Failures From Space-Weather Failures
An app should not automatically receive an “activity miss” because the observer was beneath cloud.
Use separate categories:
- Activity hit: Official or observational evidence supports elevated auroral activity during the stated window.
- Activity miss: The predicted activity did not occur within the stated window.
- Weather-blocked: Activity may have occurred, but local visibility could not be evaluated.
- Not testable: Evidence is insufficient or timestamps are unclear.
Step 4: Calculate Only Clearly Defined Rates
For a personal audit, simple rates may be calculated as:
- Activity detection rate = activity hits ÷ auditable activity alerts
- Timing usefulness rate = alerts received before a usable window ÷ timing-auditable alerts
- False-alert rate = activity misses ÷ auditable activity alerts
- Local visibility success rate = confirmed sightings ÷ alerts tested under clear, dark conditions
These are personal audit results, not universal measures of product accuracy.
A small sample from one latitude, season, phone, or solar event should not be used to declare an app “the most accurate.”
Step 5: Publish the Limitations With Any Results
A credible audit should disclose:
- dates covered;
- observing location or latitude range;
- number of alerts;
- app version;
- operating system;
- alert settings;
- data sources;
- treatment of cloud-blocked nights;
- and the definition of a hit or miss.
Without those details, an accuracy percentage is difficult to interpret or reproduce.
How Should You Evaluate an App Before Relying on It?
Use this feature scorecard before paying for an app or relying on its alerts.
Give each item:
- 0 points: Missing or unclear
- 1 point: Present but limited
- 2 points: Clear and useful
| Feature | 0 points | 1 point | 2 points |
|---|---|---|---|
| Data-source transparency | No source stated | General provider named | Specific authoritative feeds or models identified |
| Timestamps | Missing | Present on some screens | Observation, update, and forecast times are clear |
| Forecast labeling | Observed and predicted data are mixed | Partly distinguished | Observation, nowcast, and forecast are separated |
| Metric definitions | Scores are unexplained | Basic explanation | Kp, probability, and alert logic are documented |
| Local weather | No weather | Basic daily forecast | Hourly cloud and darkness information |
| Alert controls | Fixed alerts | Limited settings | Location, threshold, timing, and quiet-hour controls |
| Source access | No route to original data | Provider named | Direct access to the underlying official source |
| Uncertainty | Forecast appears certain | General disclaimer | Specific limitations and changing conditions explained |
How to Interpret the Score
- 0–5 points: Limited situational awareness
- 6–10 points: Useful only with substantial independent verification
- 11–13 points: Good general decision support
- 14–16 points: Strong transparency and usability
This score evaluates features and disclosure. It does not prove scientific forecast accuracy.
What Is the Best Step-by-Step Verification Process?
Step 1: Treat Early Alerts as Preparation Signals
An alert issued one or more days ahead should prompt preparation rather than immediate travel.
Use it to:
- keep the evening flexible;
- charge devices and camera batteries;
- identify legal viewing sites;
- monitor hourly cloud forecasts;
- and follow official updates.
Do not make an expensive booking or long drive solely because an app displays a high future Kp.
Step 2: Check an Official Regional Source
Use the operational source most relevant to your region.
| Region | Useful official source |
|---|---|
| United States | NOAA Space Weather Prediction Center |
| Europe | ESA Space Weather Service Network |
| Canada | Natural Resources Canada Space Weather |
| United Kingdom | UK Met Office Space Weather |
| Global model comparison and research | NASA CCMC |
Look for forecast timing, confidence language, expected storm level, and whether the event is associated with a CME or a recurring high-speed solar-wind stream.
Step 3: Check the Current Auroral Oval
As the viewing window approaches, use a current oval map rather than relying only on the day’s maximum forecast Kp.
Confirm:
- the map timestamp;
- whether you are under or near the oval;
- whether visibility would require looking toward the poleward horizon;
- and whether the model is running with normal upstream solar-wind input.
Step 4: Check Hourly Cloud and Darkness
Review the exact hours that overlap the expected activity window.
Check:
- low, middle, and high cloud;
- fog;
- precipitation;
- twilight;
- moonlight;
- and local light pollution.
A clear period two hours before the predicted peak may be more valuable than an overcast peak period.
Step 5: Look for Current Confirmation
Useful confirmation may come from:
- official all-sky cameras;
- observatory webcams;
- trusted local reports;
- recent photographs with timestamps and locations;
- or your own test photograph.
Give more weight to reports from a similar latitude and nearby weather region than to a viral image from hundreds of kilometers away.
Step 6: Make a Safety-Based Decision
An aurora alert should never override:
- weather warnings;
- road closures;
- avalanche or ice conditions;
- private-property boundaries;
- wildlife restrictions;
- coastal hazards;
- or personal cold-weather limits.
Do not stop on an active roadway or enter an unsafe area for a clearer horizon.
A Simplified Aurora Alert Decision Tree
Will it be dark during the forecast window?
- No: Do not expect visual aurora.
- Yes: Continue.
Is there a realistic chance of clear sky?
- No: Monitor for cloud breaks or compare safe alternative locations.
- Yes: Continue.
Is the latest oval relevant to your latitude?
- No: Continue monitoring rather than traveling.
- Yes: Continue.
Are current observations supporting the forecast?
- No: Wait for stronger confirmation if travel is costly.
- Yes: Continue.
Do you have a legal, safe site with a useful horizon?
- No: Use the safest available alternative.
- Yes: The alert is reasonably actionable.
What Are the Main Advantages and Limitations of Aurora Apps?
| Advantages | Limitations |
|---|---|
| Convenient access to several data layers | Scientific information may be oversimplified |
| Fast location-based notifications | Alerts may be early, late, or excessive |
| Easier to read than raw data services | Colorful maps may imply excessive certainty |
| Can combine space weather and cloud | Local cloud forecasts can be wrong |
| Helpful for learning recurring patterns | Proprietary scores may be undocumented |
| Useful for monitoring multiple locations | Data may be cached or delayed |
| Custom thresholds can reduce noise | Poor settings can create false confidence |
The best app is not necessarily the one that sends the most alerts. It is the one that makes its sources, timestamps, forecast horizon, and uncertainty easy to understand.
Why Did the App Say “High Chance” but I Saw Nothing?
| Problem | Likely explanation | What to check |
|---|---|---|
| Strong alert but blank sky | Cloud, haze, twilight, or light pollution | Hourly cloud layers and local sky |
| High Kp but no local display | The oval did not expand far enough | Current oval and nearby reports |
| Aurora shown nearby | Activity may be low on an obstructed horizon | Poleward view and terrain |
| Alert arrived after activity | Notification or processing delay | Data timestamp and phone settings |
| Apps disagree | Different sources, windows, or thresholds | Labels, valid time, and definitions |
| Camera shows color but eyes do not | The display is faint | Dark adaptation and exposure length |
| Forecast looked correct earlier | The active interval ended | Historical data and time-zone conversion |
| Percentage was high | The number may not represent sighting probability | App documentation |
A failed outing does not automatically prove that an app was wrong. The app’s exact claim must be compared with the event, local weather, and available evidence.
What Common Mistakes Reduce Forecast Reliability?
Relying on Kp Alone
Kp provides broad planetary context. It does not describe every local auroral feature, cloud layer, horizon obstruction, or short-lived intensification.
Treating a Future Maximum as a Current Reading
A high value predicted later in the night does not mean that activity has already reached that level.
Comparing Undefined Percentages
A 60% score from one app may measure something entirely different from a 60% score in another app.
Ignoring UTC
Many space-weather products use Coordinated Universal Time. A conversion error can move a forecast into the wrong local date or hour.
Looking Only Overhead
Near the edge of visibility, the aurora may remain low on the poleward horizon.
Assuming Camera Visibility Equals Naked-Eye Visibility
Modern phones and cameras can record faint color that appears gray or nearly invisible to the unaided eye.
Judging an App From One Night
One correct alert does not establish reliability, and one failed sighting does not establish unreliability.
Ignoring Source Outages or Fallback Data
A map may continue to display output even when its preferred input is unavailable. Check the official product notes when data appear stale or unusual.
Which Features Matter for Different Users?
Casual Local Viewer
Prioritize:
- simple location alerts;
- fresh timestamps;
- a current oval;
- hourly cloud;
- and clear definitions.
A local viewer usually does not need dozens of technical notifications.
Aurora Traveler
Prioritize:
- multiple saved locations;
- weather comparisons;
- darkness information;
- official-source links;
- and alerts that distinguish early watches from current activity.
Do not book or cancel a major trip based on one forecast value.
Photographer
Prioritize:
- short-range oval updates;
- cloud layers;
- Moon information;
- solar-wind trends;
- and customizable notifications.
Also evaluate wind, temperature, condensation risk, battery performance, and safe access.
Lower-Latitude Observer
Prioritize:
- observed storm escalation;
- confirmed equatorward expansion;
- nearby reports;
- an unobstructed poleward horizon;
- and strong real-time evidence before traveling.
The cost of a false alarm is usually higher when a long drive is required.
Technical User
Prioritize:
- source transparency;
- raw or minimally processed solar-wind data;
- Bz history;
- observed and forecast Kp;
- model timestamps;
- and direct access to official products.
An unexplained proprietary score should not replace the underlying measurements.
What Should an Aurora App Never Be Expected to Do?
An aurora app cannot be expected to:
- guarantee a sighting;
- identify the exact minute a display will brighten;
- know every local obstruction;
- perfectly predict fast-changing cloud;
- convert Kp into certain local visibility;
- determine whether a display will look colorful to the unaided eye;
- or replace official warnings and field safety decisions.
An app is one layer in a viewing decision. It is not an observation of your sky.
What Is the Practical Bottom Line?
Aurora forecast apps are reliable enough to help users prepare, monitor changing conditions, and identify periods worth investigating. They are not reliable enough to guarantee visible aurora at a particular address and time.
For a quick local check, use an app with transparent sources, current timestamps, an auroral oval, and hourly cloud. For photography or travel, verify the alert with an official forecast and current observations before committing substantial time or money. At lower latitudes, wait for stronger real-time evidence because both uncertainty and travel costs are greater.
The most dependable method is not finding a supposedly perfect app. It is using one well-documented app for notifications and independently checking the signal, the sky, and the site.
Frequently Asked Questions
Which Aurora Forecast App Is the Most Accurate?
There is no publicly established app that is most accurate for every country, latitude, forecast horizon, and viewing situation.
Choose an app that identifies its sources, displays timestamps, separates observed from forecast data, defines its scores, and provides access to the underlying official information. A defensible ranking would require a transparent, multi-event audit using consistent definitions.
How Far in Advance Can an App Predict the Aurora?
Apps may provide several days of early notice when a solar eruption or recurring solar-wind structure is identified, but exact timing and strength can change.
Once upstream solar-wind measurements are available, NOAA’s operational OVATION product normally provides about 30–90 minutes of lead time. That short-range forecast is more actionable but still does not account for all local viewing conditions.
Is Kp Enough to Decide Whether to Go Outside?
No. Kp describes broad geomagnetic disturbance over a three-hour interval.
Use it with the current auroral oval, cloud, darkness, horizon quality, timestamps, and nearby observations.
Why Do Two Apps Show Different Aurora Percentages?
They may be calculating different quantities or using different forecast windows, weather providers, location rules, and alert thresholds.
Unless both apps publish equivalent definitions, their percentages should not be directly compared.
Is a Paid Aurora App More Reliable Than a Free App?
Not necessarily.
Payment may provide better alert controls, additional saved locations, widgets, detailed weather layers, or fewer advertisements. The underlying space-weather data may still come from the same public agencies used by free products.
Evaluate transparency and usefulness rather than price alone.
Can the Aurora Be Visible Outside the Forecast Oval?
Yes. A forecast oval is not a wall.
NOAA notes that a bright aurora can sometimes be observed from a substantial distance when the sky is dark and clear and the observer has an unobstructed view toward the activity.
Sources and Editorial Approach
This guide is based on authoritative documentation, published research, and practical evaluation criteria. It does not use fabricated app tests, invented accuracy percentages, undisclosed affiliate rankings, or fictional user reviews.
Sources reviewed or accessed on August 3, 2026:
NOAA Space Weather Prediction Center — Aurora 30-Minute Forecast
Operational OVATION documentation, forecast lead time, model inputs, fallback behavior, visibility distance, and data access.NOAA Space Weather Prediction Center — Planetary K-index
Kp definition, three-hour intervals, magnetometer inputs, and watch, warning, and alert terminology.NOAA Space Weather Prediction Center — Tips on Viewing the Aurora
Viewing factors, approximate Kp relationships, darkness, location, timing, and horizon guidance.NASA Community Coordinated Modeling Center — Earth CME Scoreboard
Research-based comparison of submitted CME arrival predictions with observed arrivals.ESA Space Weather Service Network
European operational and scientific space-weather services.Natural Resources Canada — Space Weather Forecasts
Canadian geomagnetic forecasts, conditions, and regional information.UK Met Office — Auroras and Space Weather
Aurora science, forecast context, weather limitations, and viewing guidance.Machol, J. L. et al. — “Evaluation of OVATION Prime as a Forecast Model for Visible Aurorae”
Peer-reviewed evaluation of OVATION Prime as a visible-aurora forecast model. The study evaluates the model, not every commercial app that may use related data.
What This Article Does Not Claim
This article does not claim that:
- official forecasts are certain;
- every app interprets official data correctly;
- one app is universally the most accurate;
- an app percentage is a personal sighting probability;
- the Signal-to-Sky framework is a scientific model;
- the viewing-constraint tool produces a calibrated score;
- or a favorable forecast justifies unsafe or unlawful travel.
App features, data providers, pricing, and alert systems can change. Check the current product documentation before relying on a specific app.
More from Forecast Tools & Alerts
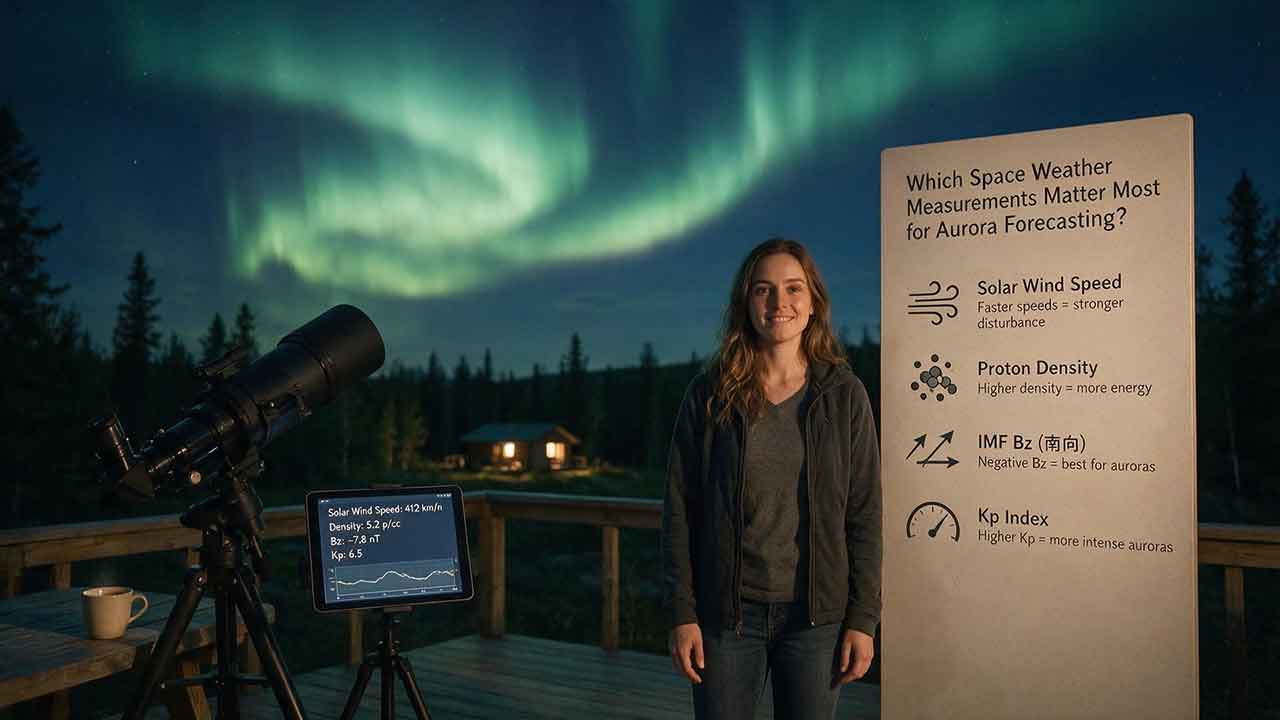
Which Space Weather Measurements Matter Most for Aurora Forecasting?
Aurora forecasting becomes more reliable when each space weather measurement is used for the right decision window. This guide explains why CME direction and propagation models matter several days ahead, while sustained southward Bz, total magnetic-field strength, solar-wind speed, density, and dynamic pressure become more useful as a disturbance approaches Earth. It also shows how Kp, auroral-oval maps, hemispheric power, AE, Dst, and local magnetometers answer different forecasting questions. Readers will learn a practical Signal–Coupling–Response–Visibility framework, compare upstream warning time with NOAA’s auroral-model guidance, work through a dynamic-pressure example, and troubleshoot conflicting forecast signals. The article also explains commonly overvalued indicators, including flare class, isolated Bz spikes, and Kp values without local-time context. Designed for aurora viewers, photographers, and travelers, it provides a clear checklist for combining official space weather data with darkness, cloud cover, road safety, and horizon visibility—without promising that any single measurement can guarantee a visible display.
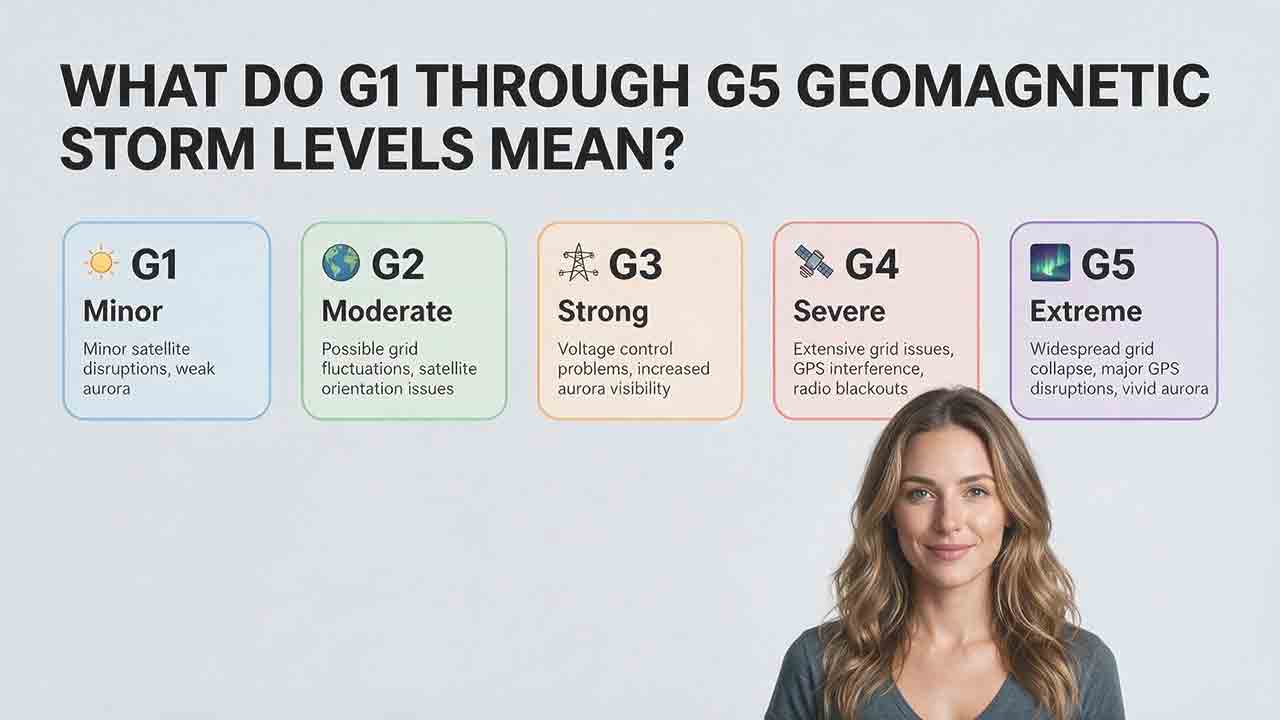
What Do G1 Through G5 Geomagnetic Storm Levels Mean?
NOAA’s G1 through G5 scale ranks geomagnetic storms from minor to extreme and translates planetary Kp measurements into practical impact categories. This guide explains the exact relationship between G levels and Kp notation, including why Kp 9− remains G4 while only Kp 9o qualifies as G5. It compares the possible effects of each level on aurora visibility, power systems, satellites, high-frequency radio, GPS, and precision navigation without treating those outcomes as guaranteed. Readers also learn how to distinguish a forecast, watch, warning, and observed alert; convert UTC forecast windows; interpret decimal Kp values such as 4.67 and 8.67; and apply the Scale–Status–Window–Location–System framework. Practical tables, a G3 watch example, common mistakes, and user-specific recommendations help the public, aurora observers, and technical users respond appropriately without unnecessary alarm.
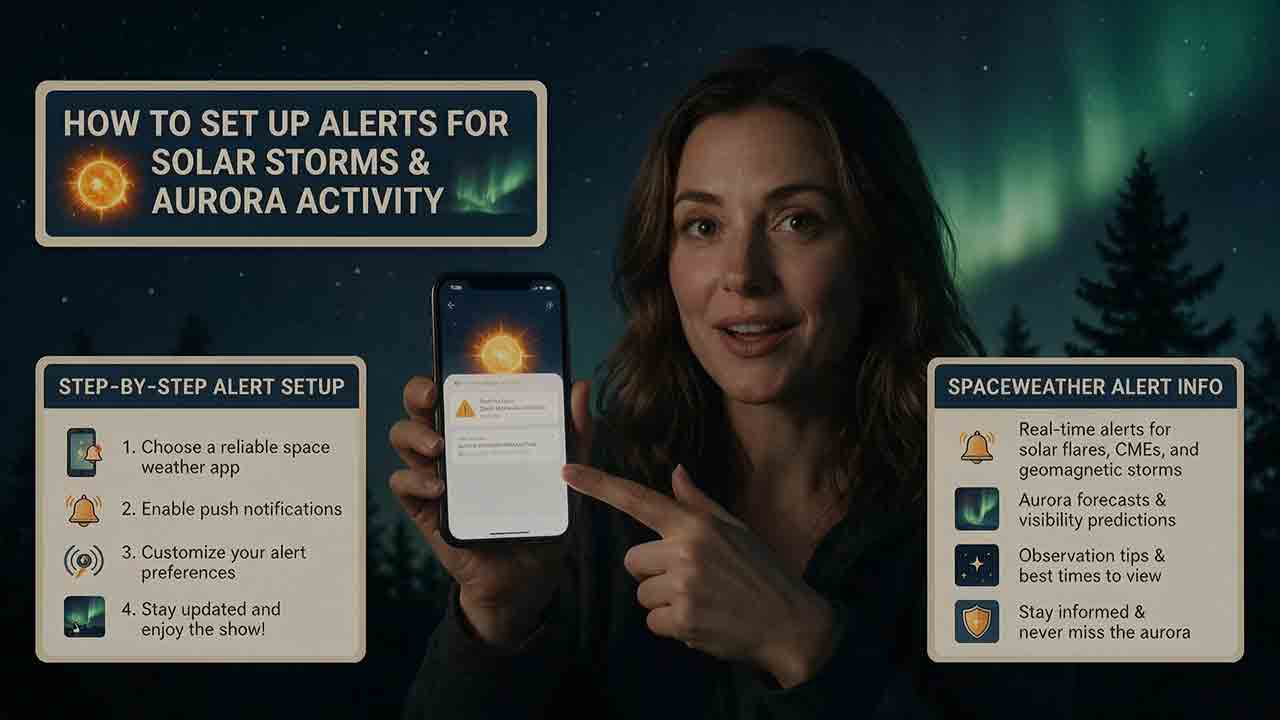
How to Set Up Alerts for Solar Storms and Aurora Activity
This practical guide explains how to build a reliable alert system for solar storms and aurora activity using official NOAA space-weather messages, location-aware aurora tools, and local weather forecasts. It clarifies the differences between forecasts, watches, warnings, and observed-threshold alerts, then shows readers how to select useful geomagnetic products, choose location-appropriate Kp thresholds, convert emails into phone notifications, and verify alerts with current auroral oval, darkness, and cloud information. The article also introduces the Three-Layer Alert Stack, Four-Gate Go-or-No-Go Check, and Two-Trigger Rule to help readers avoid acting on a single notification. Separate recommendations are included for casual observers, photographers, travelers, Southern Hemisphere viewers, amateur radio operators, and technical users. Troubleshooting steps, a notification-delivery audit, custom-alert guidance, common mistakes, and a pre-departure safety checklist make the guide useful for both initial setup and ongoing maintenance.
Explore More Topics
How to Photograph the Northern Lights
Photographing the Northern Lights requires more than choosing one fixed camera setting. This practical guide explains how to select a camera and lens, focus accurately on stars, stabilize your equipment, and adjust shutter speed, aperture, and ISO according to the aurora’s brightness and movement. It includes starting settings for fast, moderate, and faint displays, along with a Motion–Brightness–Foreground framework that helps photographers make better decisions as conditions change. Readers will also learn how to use a smartphone Night mode, compose a stronger foreground, protect color-channel highlights, edit images responsibly, and disclose exposure blends clearly. A quick-reference card, three-frame comparison method, packing checklist, safety guidance, and detailed troubleshooting table make the article useful in the field. The guide relies on published guidance from NASA, NOAA, Nikon, Canon, and Apple while clearly distinguishing authoritative information from adjustable photography recommendations.
How Far South Can the Northern Lights Be Seen?
The northern lights usually remain within high-latitude regions, but powerful geomagnetic storms can carry visible aurora surprisingly far south. This guide explains why there is no single worldwide southern boundary and shows how geomagnetic latitude, the auroral oval, Kp, storm intensity, emission altitude, darkness, cloud cover, and local light pollution affect what an observer may see. It examines NOAA’s generalized U.S. visibility examples for G1 through G5 storms, while clarifying that locations such as Alabama, Florida, and southern Texas represent rare historical possibilities rather than guaranteed forecast limits. Readers will also find an original four-gate decision framework, an auditable geometric viewing-distance example, regional viewing guidance, a practical checklist, and troubleshooting advice for distinguishing faint aurora from clouds or artificial sky glow. The article helps observers decide when a forecast justifies going outside or traveling to a safer, darker viewing site.
What Are the Best Conditions for Seeing the Northern Lights?
The best Northern Lights viewing conditions occur when geomagnetic activity, clear weather, darkness, and a suitable observing location align. This guide explains why the position of the auroral oval matters more than relying on a single Kp value and shows how cloud cover, twilight, light pollution, moonlight, atmospheric transparency, and horizon visibility affect what an observer can see. It introduces the Five-Gate Aurora Viewing Framework, a practical planning tool that evaluates aurora activity, clouds, darkness, location, and available viewing time without presenting the result as a guaranteed probability. Readers will also learn how to compare short- and long-range forecasts, convert UTC forecast periods, choose a safe dark-sky site, recognize faint aurora, and troubleshoot a promising forecast that produces no visible display. The article is based on guidance from NOAA, NASA, the University of Alaska Fairbanks, and the National Park Service.