Which Space Weather Measurements Matter Most for Aurora Forecasting?

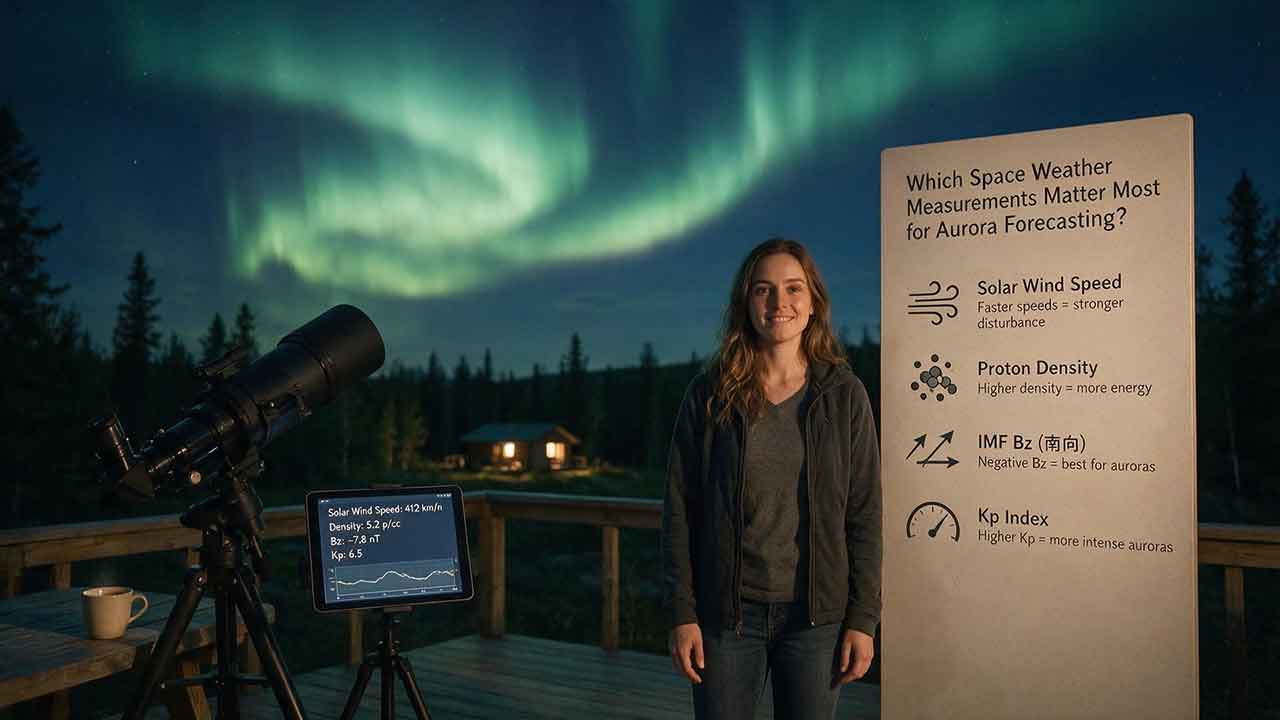
Which Space Weather Measurements Matter Most for Aurora Forecasting?
The most useful space weather measurement depends on when you need to decide. Days ahead, focus on CME direction, speed, and propagation models. Near arrival, watch sustained southward Bz, total magnetic-field strength, and solar-wind speed. For an immediate viewing decision, confirm that the auroral oval and ground measurements are responding, then check darkness, cloud cover, and horizon visibility.
Key Takeaways
- For near-term aurora viewing, Bz is often the most informative upstream coupling measurement, but its duration, total field strength, and solar-wind speed provide essential context.
- Kp is useful for broad geographic planning, but it is not a minute-by-minute trigger for one town or viewing site.
- Auroral-oval maps are usually more useful than Kp for an immediate location-based decision.
- CME observations and propagation models matter most several days ahead, before the arriving magnetic field can be measured near Earth.
- Space weather conditions are only part of the decision. Darkness, clouds, light pollution, road conditions, and a clear poleward horizon still determine whether an observer can see the aurora safely.
This guide explains which measurements deserve priority at each forecast stage, what each value can and cannot tell you, and how to combine them without treating one promising number as a guarantee.
Match the Measurement to Your Decision Window
There is no single best aurora measurement for every situation. A traveler planning several days ahead needs different information from a photographer deciding whether to leave home in the next 30 minutes.
| Decision window | Measurements or products to prioritize | Main question answered | Main limitation |
|---|---|---|---|
| 1–4 days | CME direction, apparent speed, width, coronagraph imagery, WSA-Enlil output, coronal-hole position | Is a solar-wind disturbance likely to reach Earth? | Exact arrival time, magnetic orientation, and storm strength remain uncertain |
| 6–24 hours | Official geomagnetic forecast, predicted Kp, forecast discussion, revised arrival window | Is enhanced activity still expected during local darkness? | The timing window can move, and the eventual Bz is still unknown |
| Roughly 15–60 minutes of upstream warning | Bz, Bt, speed, density, and dynamic pressure | Is the measured solar wind likely to couple efficiently with Earth’s magnetosphere? | Propagation time varies, and a favorable measurement does not guarantee local aurora |
| Approximately 30–90 minutes of model guidance | NOAA OVATION-based auroral forecast | Where is auroral activity expected to be concentrated? | The model may use fallback forcing and lose its normal forecast lead time |
| Now | Auroral oval, hemispheric power, AE, local magnetometers, aurora cameras, verified observations | Is Earth’s magnetic and auroral system responding? | Activity may be poorly positioned for one observer |
| At the viewing site | Darkness, clouds, transparency, moonlight, light pollution, road access, horizon | Can the aurora actually be seen safely from this location? | These checks cannot predict how long the activity will continue |
The two short-term time ranges describe related but different things.
Upstream spacecraft measurements may provide roughly 15–60 minutes of propagation warning under some conditions. NOAA describes its Aurora—30 Minute Forecast as providing approximately 30–90 minutes of guidance from the OVATION model. The product window includes its own operational modeling and should not be treated as identical to a simple spacecraft-to-Earth travel-time estimate.
Read Aurora Data in This Order
A good forecast workflow follows the disturbance from the Sun to the viewing site. It does not begin by opening every chart and looking for the largest number.
1. Define the Decision
Start with the practical question:
- Are you choosing a travel date several days away?
- Are you deciding whether to prepare equipment for tonight?
- Are you considering a drive within the next hour?
- Are you already outside watching the sky?
A CME propagation model can be valuable three days before a possible arrival. Once a disturbance reaches an upstream monitor, live magnetic-field and plasma measurements become more useful.
The reverse is also true: a short negative Bz reading now cannot tell you whether next weekend will be active.
2. Identify the Expected Driver
For multi-day planning, determine whether forecasters are monitoring:
- An Earth-directed coronal mass ejection
- A coronal-hole high-speed stream
- A stream interaction region
- Multiple interacting disturbances
- No clearly identified solar-wind driver
CME launch time, direction, width, and estimated speed help forecasters judge whether part of an eruption may cross Earth. Coronal holes can produce recurrent fast solar wind when their position connects the outflow with Earth.
Use the official NOAA WSA-Enlil Solar Wind Prediction as an early-warning tool, not as a promise of visible aurora.
3. Read the Official Forecast and Its Rationale
The NOAA 3-Day Forecast and NOAA 3-Day Geomagnetic Forecast provide forecast periods and explanatory context.
Ask:
- Which UTC periods have the highest predicted activity?
- Do those periods overlap darkness at your location?
- Is the forecast based on a CME, a high-speed stream, or uncertain conditions?
- Has the expected arrival window moved since the previous forecast?
- Is the forecast being upgraded, downgraded, or maintained?
The forecast rationale matters. Two predictions with the same Kp value may not have the same confidence. A well-observed Earth-directed CME and an uncertain glancing encounter should not be treated as equivalent scenarios.
4. Switch to Live Solar-Wind Measurements
When a disturbance is expected near Earth, open the NOAA Solar Wind Observations display.
Read the measurements in this order:
- Bz orientation and duration
- Total magnetic-field strength, usually labeled Bt
- Solar-wind speed
- Density and pressure changes
- Timestamp, active source, missing data, and suspicious values
Check trends rather than reacting to one data point. A five-minute pattern is usually more informative than one dramatic value that disappears on the next update.
Current NOAA data-source note: As of August 3, 2026, NOAA identifies SOLAR-1 as its primary operational solar-wind source, with ACE serving as backup until IMAP I-ALiRT provides continuous coverage. NOAA has stopped operational ingest and processing of DSCOVR solar-wind data. Because this operational status may change, readers should confirm the active source on NOAA’s current solar-wind display.
The scientific meaning of Bz, Bt, density, and speed is not tied to one spacecraft. The active operational source can change, which is why the source label and timestamp matter.
5. Confirm an Earth Response
Favorable upstream measurements show that increased energy transfer may occur. They do not prove that the auroral oval has already expanded toward your location.
Before traveling, check:
- Whether the modeled oval is expanding equatorward
- Whether hemispheric power is rising
- Whether high-latitude or local magnetometers are responding
- Whether AE is increasing
- Whether aurora cameras or credible observers confirm activity
- Whether the active sector is in darkness at your longitude
This confirmation step separates a promising solar-wind signal from an actual auroral response.
Why Bz Deserves Close Attention
Bz describes the north–south component of the interplanetary magnetic field in a coordinate system commonly used for space weather monitoring.
A southward Bz is generally favorable for magnetic reconnection at Earth’s dayside magnetopause. This orientation can allow solar-wind energy to enter the magnetosphere more efficiently. A northward Bz usually reduces that particular coupling pathway.
For aurora viewers, however, the important question is not simply whether Bz has crossed below zero.
Duration Matters More Than One Extreme Reading
A brief southward spike may end before a substantial response develops. It may also represent a short fluctuation or a questionable data point.
A stronger interpretation asks:
- Has Bz remained predominantly southward through several updates?
- Is the southward component strengthening or weakening?
- Is Bt elevated?
- Is solar-wind speed sustained?
- Are ground and auroral indicators beginning to respond?
There is no universal Bz threshold that guarantees visible aurora from a particular city. Magnetic latitude, local time, previous magnetospheric conditions, field strength, speed, and the structure of the disturbance all affect the result.
Aurora Can Continue After Bz Turns Northward
The magnetosphere does not respond like an instantaneous switch.
Energy stored during an earlier southward interval can continue to be released. An auroral substorm may therefore intensify or remain active after the newest upstream Bz reading has turned northward.
That delay is another reason to compare live solar-wind data with the auroral oval and ground measurements.
How Bt and Solar-Wind Speed Change the Picture
Bz indicates magnetic orientation. Bt and speed help show how much magnetic disturbance is present and how quickly it is being delivered.
Bt Shows the Total Field Strength
Bt is the magnitude of the interplanetary magnetic field.
A southward component generally becomes more consequential when the total field is strong. If Bt is weak, a favorable orientation may still provide limited energy input. If Bt is strong but Bz remains mainly northward, the field may be poorly oriented for efficient dayside coupling.
A practical reading order is:
- Check whether Bt is elevated.
- Check how much of the field appears in southward Bz.
- Watch how long the orientation persists.
- Compare the field conditions with solar-wind speed.
Speed Acts More Like an Amplifier Than a Switch
Faster solar wind can transport energy past Earth more rapidly and can strengthen coupling when the magnetic orientation is favorable.
High speed alone does not guarantee a large auroral expansion. A fast stream with weak or northward Bz can produce less visual activity than a slower flow with strong, sustained southward Bz.
A useful viewing analogy is:
Bz helps indicate whether the coupling door is open; solar-wind speed helps indicate how forcefully energy is being delivered.
This is a simplified decision aid, not a complete physical description.
A Simple Upstream Travel-Time Estimate
A basic estimate is:
Estimated travel time = remaining propagation distance ÷ solar-wind speed
Using an illustrative distance of 1.5 million kilometers:
| Solar-wind speed | Simple travel-time estimate |
|---|---|
| 400 km/s | About 62.5 minutes |
| 500 km/s | About 50 minutes |
| 700 km/s | About 35.7 minutes |
These values are not exact countdowns. Spacecraft position, solar-wind structure, propagation methods, and operational processing affect the usable warning time.
NASA describes the Sun–Earth L1 region as roughly 1.5 million kilometers toward the Sun. The NASA DSCOVR overview provides useful historical context for upstream monitoring, although NOAA’s current operational source should be confirmed on the live NOAA display.
What Density and Dynamic Pressure Add
Density and dynamic pressure are particularly useful for recognizing the arrival of compressed solar-wind structures.
They should normally be treated as supporting measurements rather than standalone aurora predictors.
Density Can Signal an Arrival
A sharp rise in proton density can occur near:
- A shock
- A compressed sheath region
- A stream interaction region
- A dense solar-wind structure
Density can therefore help answer, “Has a disturbance or compression reached the monitor?”
It does not answer, “Will strong aurora follow?” The magnetic orientation inside and behind the compressed region remains critical.
Dynamic Pressure Measures the Strength of the Flow
Solar-wind dynamic pressure depends on mass density and the square of speed.
For a proton-only approximation:
Pdynamic ≈ 1.67 × 10^-6 × np × v^2
where:
Pdynamicis in nanopascalsnpis proton density in cm^-3vis solar-wind speed in km/s
The proton-only approximation does not include the additional mass carried by alpha particles.
NASA’s OMNI parameter derivation uses a larger coefficient when assuming an alpha-particle density equal to about 5% of the proton density:
Pflow ≈ 2.0 × 10^-6 × np × v^2
Where measured alpha density is available, a more complete mass-density calculation can be used.
Worked Comparison
Consider two simplified proton-only cases.
Scenario A
- Proton density: 5 cm^-3
- Speed: 400 km/s
Pdynamic ≈ 1.67 × 10^-6 × 5 × 400^2
Pdynamic ≈ 1.34 nPa
Scenario B
- Proton density: 10 cm^-3
- Speed: 600 km/s
Pdynamic ≈ 1.67 × 10^-6 × 10 × 600^2
Pdynamic ≈ 6.01 nPa
Scenario B has approximately 4.5 times the proton-only dynamic pressure of Scenario A. This difference shows why the squared speed term matters.
A pressure pulse can compress the magnetosphere and produce a sudden magnetic response. Sustained auroral expansion still depends heavily on magnetic orientation and continued energy input.
These are worked educational examples based on published formulas, not original spacecraft measurements or a reconstruction of a real event.
Use Kp and the Auroral Oval for Different Jobs
Kp and an auroral-oval map answer different questions.
| Product | Best use | Main limitation |
|---|---|---|
| Forecast Kp | Planning several hours or days ahead | Does not show the exact oval shape or local timing |
| Estimated or observed Kp | Describing broad global geomagnetic disturbance | Represents three-hour intervals rather than a local minute-by-minute trigger |
| Auroral-oval map | Judging where auroral precipitation is concentrated now or soon | Model output can be delayed, smoothed, or driven by fallback inputs |
| Local magnetometer | Detecting rapid magnetic changes near a region | One station does not represent the entire auroral zone |
| Aurora camera or verified report | Confirming visible activity | Limited by clouds, darkness, camera sensitivity, and geographic coverage |
Where Kp Helps
The planetary Kp index summarizes geomagnetic disturbance using measurements from a standardized group of ground observatories.
Use it to:
- Compare expected activity with your region’s usual viewing opportunities
- Identify broad geomagnetic storm conditions
- Decide whether an event deserves continued monitoring
- Communicate global disturbance through a familiar scale
The NOAA Planetary K-index display may update frequently, but Kp still represents three-hour geomagnetic intervals. A frequently refreshed chart does not turn Kp into a minute-resolution local predictor.
What Kp Cannot Show
Kp does not directly reveal:
- The exact shape of the auroral oval
- Whether an active sector is over your longitude
- Whether a substorm will begin in the next few minutes
- Whether the aurora will be overhead or low on the horizon
- Whether the displayed value is forecast, estimated, preliminary, or definitive
- Whether clouds or daylight block the view
Apps sometimes place forecast Kp, estimated Kp, and an earlier observed maximum close together. Always check the label and timestamp.
Why the Oval Is Better for an Immediate Location Check
The NOAA OVATION-based product estimates the location and intensity of auroral activity in both hemispheres.
It helps answer:
- Is the active region approaching my magnetic latitude?
- Is the relevant part of the oval in darkness?
- Is the modeled activity strengthening or retreating?
- Am I more likely to see overhead activity or a low poleward glow?
The colored edge is not a hard visibility wall. Bright aurora may be visible beyond the strongest modeled region when the site is dark and the poleward horizon is clear.
Check Whether the Oval Has Forecast Lead Time
Under normal conditions, OVATION uses upstream solar-wind speed and interplanetary magnetic-field measurements.
When suitable upstream data are unavailable or contaminated, NOAA can drive the model with current Kp instead. In that fallback mode, NOAA states that the product has no forecast lead time.
Before treating the map as a short-term forecast, check:
- The product timestamp
- The displayed data status
- Whether upstream solar-wind forcing is available
- Whether the model is using Kp-based fallback forcing
This limitation is easy to overlook and can explain why a map behaves more like a nowcast than a forecast.
Confirm the Response With Hemispheric Power, AE, and Magnetometers
These measurements help determine whether Earth’s magnetic and auroral system is responding. They do not describe identical processes.
Hemispheric Power
Hemispheric power estimates the total auroral energy input over one polar region.
A rising value can indicate a more energetic auroral system, but it does not show exactly where the energy is concentrated. A high value can still be poorly positioned for one observer.
Use hemispheric power with the oval rather than instead of it.
AE Index
The Auroral Electrojet index measures activity in high-latitude electrical currents using ground magnetometers.
AE is useful for recognizing strong auroral-electrojet activity and substorm-related responses. It can be particularly informative for observers within or close to the normal auroral zone.
The World Data Center for Geomagnetism, Kyoto cautions that real-time values are provisional and that missing stations can reduce detection capability. Treat real-time AE as a monitoring signal, not a final definitive record.
Dst Index
Dst is associated mainly with the large-scale ring current that develops during geomagnetic storms.
It helps describe storm development and recovery, but it is not a direct map of visible aurora. Fast auroral substorms and major Dst changes can evolve on different timescales.
For most viewing decisions, Dst is secondary to the oval, live solar-wind conditions, and high-latitude magnetic response.
Local Magnetometers
A magnetometer near your region can reveal rapid changes that a global three-hour index may smooth over.
Local data are especially valuable when:
- You live near the auroral zone
- A substorm may be developing
- Global Kp remains moderate
- You need confirmation before leaving home
Compare more than one nearby station when possible. One station can be affected by local-time geometry, noise, or missing data.
Several Days Ahead, Watch the Solar Driver
Before the disturbance reaches an upstream monitor, forecasters cannot directly measure the Bz that will arrive at Earth.
Multi-day forecasting therefore depends on remote observations and propagation estimates.
Important inputs include:
- CME launch time
- Apparent CME speed
- Estimated width and direction
- Whether Earth is near the modeled path
- Coronal-hole location
- Background solar-wind structure
- Possible interaction with earlier CMEs or streams
- Agreement among model runs and forecast discussions
A modeled Earth encounter is a reason to monitor. It is not a guarantee of a strong geomagnetic storm.
Why an Accurate Arrival Forecast Can Still Produce Weak Aurora
A CME can:
- Arrive with mostly northward Bz
- Deliver only a glancing encounter
- Contain a short favorable sheath followed by unfavorable ejecta
- Interact with another solar-wind structure
- Arrive during local daylight
- Produce strong activity over a different longitude
- Reach Earth earlier or later than initially expected
Propagation models can estimate whether a disturbance may arrive. They cannot reliably reveal the exact magnetic orientation that will pass Earth several days later.
Measurements Viewers Commonly Overvalue
Some measurements are scientifically important but weak standalone guides for an aurora trip.
Solar Flare Class
A strong solar flare does not automatically produce a geomagnetic storm.
Flares are bursts of electromagnetic radiation. Strong aurora away from the normal auroral zone more often depends on a CME or another solar-wind disturbance reaching Earth with favorable magnetic conditions.
A flare can accompany a CME, but flare class cannot replace CME analysis.
Sunspot Number
Sunspot number describes the broader level of solar activity. It cannot tell you whether an Earth-directed disturbance will arrive on a particular night.
Energetic Proton Flux
Proton measurements are important for radiation-storm monitoring and some operational systems. They are not a substitute for geomagnetic or auroral measurements.
One Dramatic Bz Reading
An isolated negative spike can produce an exciting app notification. Without duration, Bt, speed, data quality, and a subsequent Earth response, its decision value is limited.
A High Kp Forecast Without Time Conversion
A high predicted Kp interval may occur during daylight at your location.
Convert UTC to local time before making travel plans, and confirm that the best interval overlaps sufficient darkness.
A Four-Layer Aurora Decision Framework
For practical viewing decisions, organize the available information into four layers:
| Layer | Question | Measurements or checks |
|---|---|---|
| Signal | Is a disturbance likely to reach Earth? | CME imagery, coronal holes, WSA-Enlil, official forecast discussion |
| Coupling | Is the arriving solar wind favorably configured to transfer energy? | Bz, Bt, speed, density, dynamic pressure |
| Response | Is Earth’s magnetic and auroral system reacting? | Auroral oval, hemispheric power, AE, Kp trend, magnetometers |
| Visibility | Can the observer see the result safely? | Darkness, cloud, transparency, moonlight, light pollution, roads, horizon |
The framework explains several common forecast failures:
- A credible solar event can arrive with an unfavorable magnetic orientation.
- Favorable Bz may not persist long enough to produce a large response.
- Strong geomagnetic activity may remain too far poleward.
- A correctly forecast display may be hidden by cloud or daylight.
This guide adds an original decision framework and worked examples based on authoritative published data definitions. The framework organizes existing measurements; it has not been validated as an independent forecasting algorithm and is not an official NOAA, NASA, GFZ, or academic model.
A Practical Example: Should the Observer Leave Now?
Consider a hypothetical observer who lives south of the usual auroral oval and is deciding whether to drive 45 minutes to a dark site.
This is an educational example, not a report of a real event.
Early Forecast
A CME is expected during the evening, and the geomagnetic forecast is high enough to justify monitoring. The arrival window remains several hours wide.
Decision: Charge equipment, check road and weather conditions, and monitor updates. Do not leave solely because of the early model.
Possible Arrival
Live measurements show a density increase, stronger Bt, and rising solar-wind speed.
Interpretation: A compressed region may have reached the upstream monitor. Arrival evidence alone does not establish favorable coupling.
Coupling Improves
Bz turns southward and remains predominantly southward through several updates while speed and Bt remain elevated.
Interpretation: The probability of meaningful energy transfer has increased. The observer should now look for an Earth response.
Earth Responds
High-latitude magnetometers become more active, hemispheric power rises, and the modeled oval expands toward the observer’s magnetic latitude.
Estimated Kp may also trend upward, but it remains a broad three-hour summary rather than a minute-by-minute local trigger.
Decision: The situation has progressed from a possible event to a credible viewing opportunity.
Visibility Checks Pass
The observer confirms:
- A clear poleward horizon
- Sufficient darkness
- No approaching cloud bank
- Safe road and parking conditions
- Appropriate cold-weather clothing
- A charged phone and camera
Decision: The full Signal–Coupling–Response–Visibility chain supports making the trip. Strong aurora is still not guaranteed to continue throughout the drive.
Common Mistakes and Better Alternatives
Watching Only Kp
Kp provides broad context but hides exact location and short-term behavior.
Better approach: Use Kp for planning, then confirm live solar wind, oval movement, and local conditions.
Treating Negative Bz as an Immediate Guarantee
A short southward interval may end before a strong response develops.
Better approach: Watch the trend and confirm activity in auroral or ground-based indicators.
Confusing a Flare With an Earth-Directed CME
A flare alert does not confirm that a CME will reach Earth.
Better approach: Look for an official CME analysis and modeled arrival window.
Ignoring the Timestamp or Active Data Source
A dramatic number may be stale, delayed, or associated with a feed interruption.
Better approach: Check the timestamp, source spacecraft, and surrounding measurements.
Using Geographic Latitude Alone
Auroral occurrence follows Earth’s magnetic environment more closely than simple geographic latitude.
Better approach: Compare your position with the modeled oval and magnetic latitude.
Ignoring Local Safety and Weather
A good space weather forecast does not justify hazardous driving or exposure to severe weather.
Better approach: Treat road conditions, temperature, cloud cover, and safe access as required final checks.
Troubleshooting Conflicting Signals
High forecast Kp, but live activity remains weak
Likely explanation: The disturbance may be late, weaker than expected, or not yet at Earth.
Check next: Density, Bt, speed, official forecast updates, and arrival notices.
Bz is southward, but the oval is not expanding
Likely explanation: The interval may be brief, Bt may be weak, speed may be modest, or the magnetospheric response may be delayed.
Check next: Bz duration, Bt, speed, hemispheric power, AE, and nearby magnetometers.
Density spikes, but auroral activity remains limited
Likely explanation: A compression arrived without sustained favorable magnetic orientation.
Check next: Bz and Bt after the density increase.
Two apps show different values
Likely explanation: They may use different sources, refresh rates, smoothing methods, model versions, or cached forecasts.
Check next: The source label, UTC timestamp, metric definition, and official NOAA product.
Kp rises, but nothing is visible
Likely explanation: The active oval may remain poleward, the strongest sector may be over another longitude, or local conditions may block the view.
Check next: Oval position, darkness, cloud cover, magnetic latitude, and the poleward horizon.
A camera detects color that the eye cannot see
Likely explanation: Cameras can collect faint light and color more effectively than human night vision.
Check next: Dark adaptation, light pollution, sky transparency, and realistic visual expectations.
The auroral map appears frozen or loses lead time
Likely explanation: Upstream data may be unavailable or contaminated, causing OVATION to use Kp-based fallback forcing.
Check next: The product timestamp, status information, and whether live upstream forcing is available.
A 13-Step Aurora Decision Checklist
- Identify the expected driver: CME, high-speed stream, or uncertain.
- Read the official forecast rationale, not only the predicted Kp.
- Convert UTC forecast periods to local time.
- Confirm that the most active interval overlaps darkness.
- Check whether a disturbance appears to have reached upstream monitors.
- Look for sustained rather than momentary southward Bz.
- Read Bt and solar-wind speed alongside Bz.
- Treat density and pressure rises mainly as arrival or compression evidence.
- Confirm that the auroral oval or ground measurements are responding.
- Check whether OVATION is using live upstream data or Kp-based fallback forcing.
- Verify timestamps and active data-source labels.
- Check clouds, transparency, light pollution, roads, temperature, and horizon visibility.
- Recheck conditions immediately before departure.
The checklist is sequential for a reason. A strong result in one layer should not be mistaken for a complete viewing forecast.
Who This Guide Is—and Is Not—For
This article is intended for:
- Casual aurora viewers
- Aurora photographers
- Travelers evaluating aurora alerts
- Amateur space weather observers
- Educators and publishers explaining forecast dashboards
It is not operational guidance for:
- Aviation
- Electric-grid management
- Satellite operations
- Navigation-system integrity
- Emergency response
- Radio-system management
- Other safety-critical technical decisions
Professionals responsible for those systems should follow the official products, procedures, and thresholds designated by their organizations and relevant authorities.
How This Article Was Prepared
This guide is based on authoritative documentation, published data definitions, and practical decision criteria rather than hands-on testing of commercial aurora apps.
The measurement hierarchy was developed around three questions:
- Which information is available at each forecast horizon?
- Which physical process does each measurement represent?
- Which practical decision can a non-specialist reasonably make from it?
The article does not claim that one measurement guarantees visible aurora, that the worked examples represent real observations, or that this viewing framework has an independently measured accuracy rate.
Choose the Next Measurement Based on Your Timeline
Planning several days ahead: Follow CME analysis, coronal-hole forecasts, WSA-Enlil output, and official forecast discussions. Keep travel plans flexible.
Planning for tonight: Compare predicted geomagnetic activity with local darkness and monitor changes to the arrival window.
Deciding whether to leave now: Prioritize sustained southward Bz, Bt, speed, oval movement, ground response, and data freshness.
Already at the viewing site: Watch the sky as well as the dashboard. Check the poleward horizon, allow time for dark adaptation, and use nearby cameras or magnetometers to identify developing activity.
The most defensible sequence is:
Solar driver → upstream coupling → Earth response → local visibility
No individual measurement completes that chain. Combining measurements according to forecast horizon produces a more useful decision than relying on a flare alert, a single Kp value, or one brief Bz spike.
Frequently Asked Questions
Is Bz more important than Kp for aurora forecasting?
For near-term upstream coupling, Bz is often more informative because it indicates whether the interplanetary magnetic field is favorably oriented for energy transfer. Kp is more useful for describing or forecasting broad global geomagnetic disturbance. The two measurements answer different questions.
How long must Bz remain southward?
There is no universal duration that guarantees visible aurora. The outcome depends on Bz magnitude, Bt, solar-wind speed, previous magnetospheric conditions, magnetic latitude, and local time. A sustained trend is generally more meaningful than an isolated dip.
Can fast solar wind produce aurora with northward Bz?
Fast solar wind can support disturbed conditions, particularly within complex high-speed streams, but persistent northward Bz generally limits efficient dayside coupling. Speed should therefore be interpreted with field orientation and total field strength.
Is hemispheric power better than the auroral oval?
No. Hemispheric power estimates total auroral energy over a polar region, while the oval shows where that activity is distributed. Hemispheric power provides intensity context; the oval is usually more useful for location-specific viewing decisions.
Why does an aurora app disagree with NOAA?
The app may use a different model, source, refresh interval, smoothing method, geographic calculation, or cached forecast. It may also combine cloud probability with geomagnetic activity. Check what the displayed percentage represents and compare its timestamp with NOAA’s current products.
Which three measurements should a beginner watch?
Start with the auroral oval, Kp, and Bz. The oval shows location, Kp provides broad geomagnetic context, and Bz helps indicate near-term coupling. Once those are familiar, add Bt and solar-wind speed.
Sources
- NOAA Space Weather Prediction Center, “Aurora—30 Minute Forecast”. Accessed August 3, 2026.
- NOAA Space Weather Prediction Center, “Solar Wind Observations”. Accessed August 3, 2026.
- NOAA Space Weather Prediction Center, “Solar Wind Data and Display Changes”. Published June 30, 2026; accessed August 3, 2026.
- NOAA Space Weather Prediction Center, “WSA-Enlil Solar Wind Prediction”. Accessed August 3, 2026.
- NOAA Space Weather Prediction Center, “3-Day Forecast”. Accessed August 3, 2026.
- NOAA Space Weather Prediction Center, “3-Day Geomagnetic Forecast”. Accessed August 3, 2026.
- NOAA Space Weather Prediction Center, “Planetary K-index”. Accessed August 3, 2026.
- NASA Earthdata, “Deep Space Climate Observatory”. Accessed August 3, 2026.
- NASA Goddard Space Flight Center OMNIWeb, “Detailed Derivation of Parameters”. Accessed August 3, 2026.
- GFZ Helmholtz Centre for Geosciences, “Kp Index Data”. Accessed August 3, 2026.
- World Data Center for Geomagnetism, Kyoto, “Dst and AE Indices”. Accessed August 3, 2026.
More from Forecast Tools & Alerts
How Reliable Are Aurora Forecast Apps?
Aurora forecast apps are useful for identifying periods of elevated geomagnetic activity, but they cannot guarantee that the northern lights will be visible from a specific location at a specific time. This guide explains why app alerts sometimes disagree, how forecast reliability changes as an event approaches, and which measurements deserve the most attention. Readers will learn how to interpret the auroral oval, observed and forecast Kp, solar-wind speed, Bz, cloud cover, darkness, timestamps, and official space-weather alerts. The article also introduces the Signal-to-Sky Reliability Framework, a viewing-location comparison tool, and a transparent method for auditing app notifications without inventing accuracy claims. Practical tables, troubleshooting guidance, and a step-by-step verification process help casual observers, photographers, travelers, and lower-latitude aurora chasers decide when an alert is worth acting on. The guide is based on authoritative documentation and published research rather than hands-on commercial app rankings.
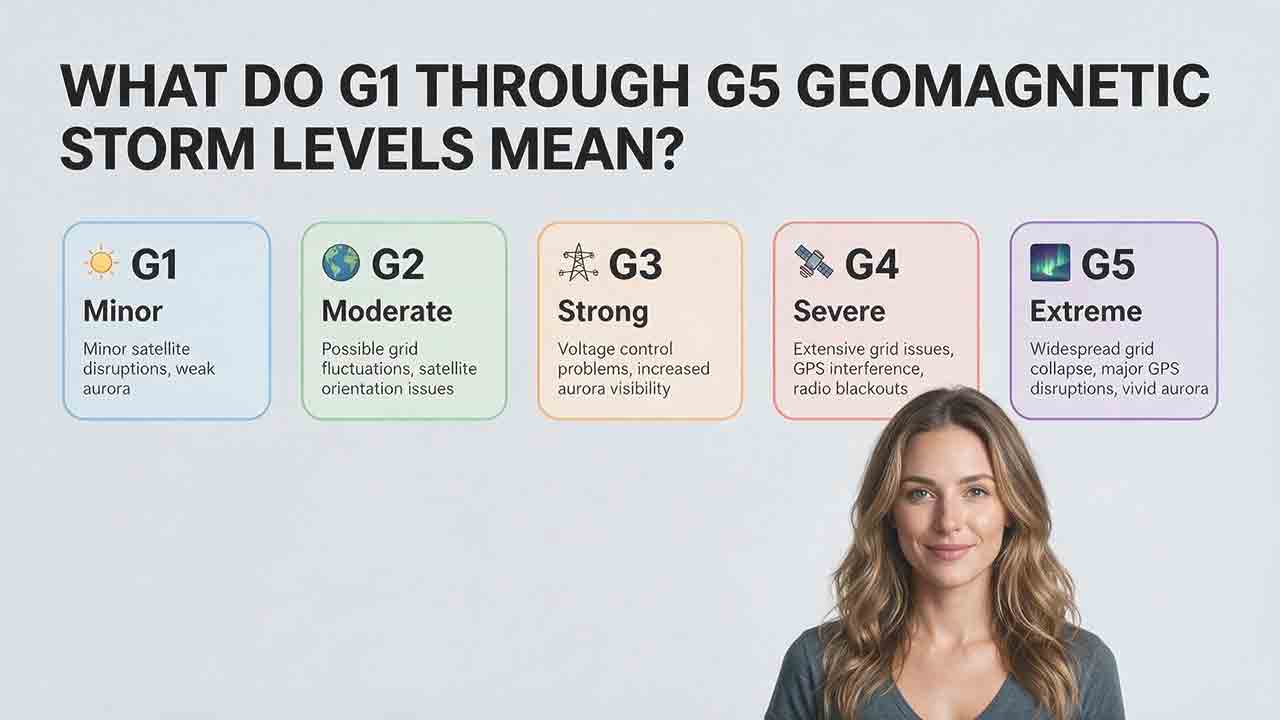
What Do G1 Through G5 Geomagnetic Storm Levels Mean?
NOAA’s G1 through G5 scale ranks geomagnetic storms from minor to extreme and translates planetary Kp measurements into practical impact categories. This guide explains the exact relationship between G levels and Kp notation, including why Kp 9− remains G4 while only Kp 9o qualifies as G5. It compares the possible effects of each level on aurora visibility, power systems, satellites, high-frequency radio, GPS, and precision navigation without treating those outcomes as guaranteed. Readers also learn how to distinguish a forecast, watch, warning, and observed alert; convert UTC forecast windows; interpret decimal Kp values such as 4.67 and 8.67; and apply the Scale–Status–Window–Location–System framework. Practical tables, a G3 watch example, common mistakes, and user-specific recommendations help the public, aurora observers, and technical users respond appropriately without unnecessary alarm.
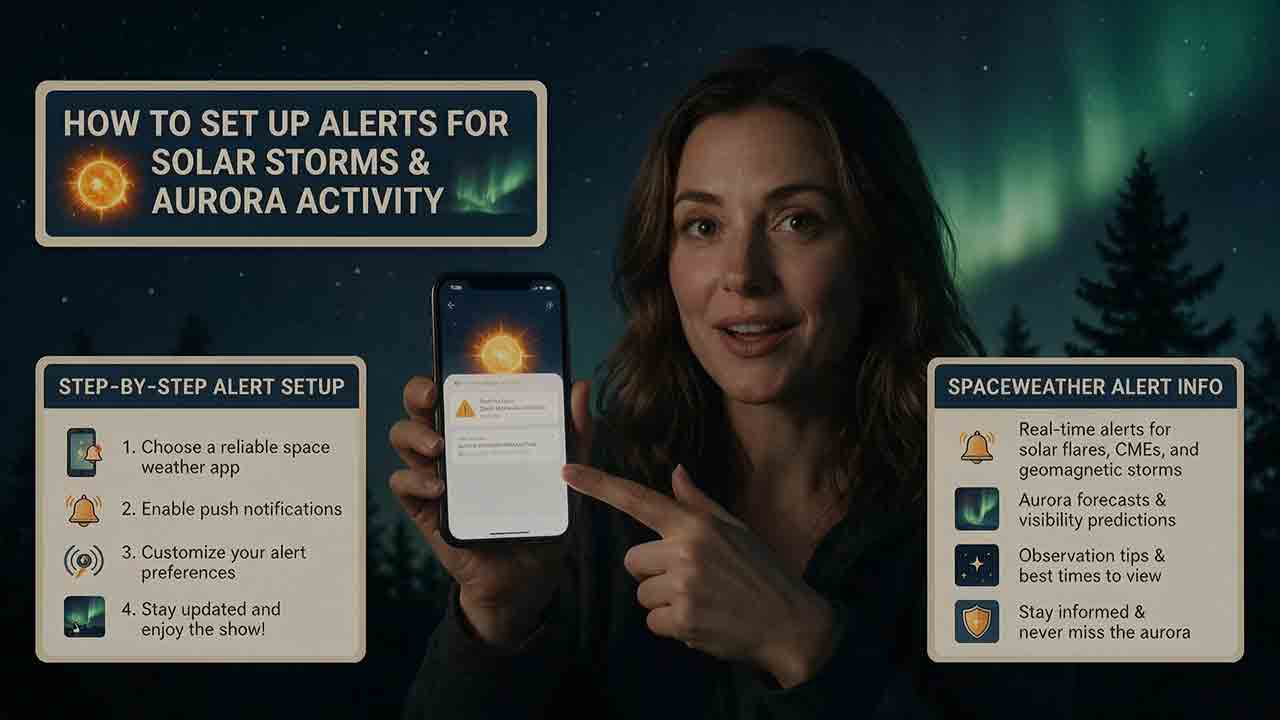
How to Set Up Alerts for Solar Storms and Aurora Activity
This practical guide explains how to build a reliable alert system for solar storms and aurora activity using official NOAA space-weather messages, location-aware aurora tools, and local weather forecasts. It clarifies the differences between forecasts, watches, warnings, and observed-threshold alerts, then shows readers how to select useful geomagnetic products, choose location-appropriate Kp thresholds, convert emails into phone notifications, and verify alerts with current auroral oval, darkness, and cloud information. The article also introduces the Three-Layer Alert Stack, Four-Gate Go-or-No-Go Check, and Two-Trigger Rule to help readers avoid acting on a single notification. Separate recommendations are included for casual observers, photographers, travelers, Southern Hemisphere viewers, amateur radio operators, and technical users. Troubleshooting steps, a notification-delivery audit, custom-alert guidance, common mistakes, and a pre-departure safety checklist make the guide useful for both initial setup and ongoing maintenance.
Explore More Topics
How to Photograph the Northern Lights
Photographing the Northern Lights requires more than choosing one fixed camera setting. This practical guide explains how to select a camera and lens, focus accurately on stars, stabilize your equipment, and adjust shutter speed, aperture, and ISO according to the aurora’s brightness and movement. It includes starting settings for fast, moderate, and faint displays, along with a Motion–Brightness–Foreground framework that helps photographers make better decisions as conditions change. Readers will also learn how to use a smartphone Night mode, compose a stronger foreground, protect color-channel highlights, edit images responsibly, and disclose exposure blends clearly. A quick-reference card, three-frame comparison method, packing checklist, safety guidance, and detailed troubleshooting table make the article useful in the field. The guide relies on published guidance from NASA, NOAA, Nikon, Canon, and Apple while clearly distinguishing authoritative information from adjustable photography recommendations.
How Far South Can the Northern Lights Be Seen?
The northern lights usually remain within high-latitude regions, but powerful geomagnetic storms can carry visible aurora surprisingly far south. This guide explains why there is no single worldwide southern boundary and shows how geomagnetic latitude, the auroral oval, Kp, storm intensity, emission altitude, darkness, cloud cover, and local light pollution affect what an observer may see. It examines NOAA’s generalized U.S. visibility examples for G1 through G5 storms, while clarifying that locations such as Alabama, Florida, and southern Texas represent rare historical possibilities rather than guaranteed forecast limits. Readers will also find an original four-gate decision framework, an auditable geometric viewing-distance example, regional viewing guidance, a practical checklist, and troubleshooting advice for distinguishing faint aurora from clouds or artificial sky glow. The article helps observers decide when a forecast justifies going outside or traveling to a safer, darker viewing site.
What Are the Best Conditions for Seeing the Northern Lights?
The best Northern Lights viewing conditions occur when geomagnetic activity, clear weather, darkness, and a suitable observing location align. This guide explains why the position of the auroral oval matters more than relying on a single Kp value and shows how cloud cover, twilight, light pollution, moonlight, atmospheric transparency, and horizon visibility affect what an observer can see. It introduces the Five-Gate Aurora Viewing Framework, a practical planning tool that evaluates aurora activity, clouds, darkness, location, and available viewing time without presenting the result as a guaranteed probability. Readers will also learn how to compare short- and long-range forecasts, convert UTC forecast periods, choose a safe dark-sky site, recognize faint aurora, and troubleshoot a promising forecast that produces no visible display. The article is based on guidance from NOAA, NASA, the University of Alaska Fairbanks, and the National Park Service.