How to Read an Aurora Forecast

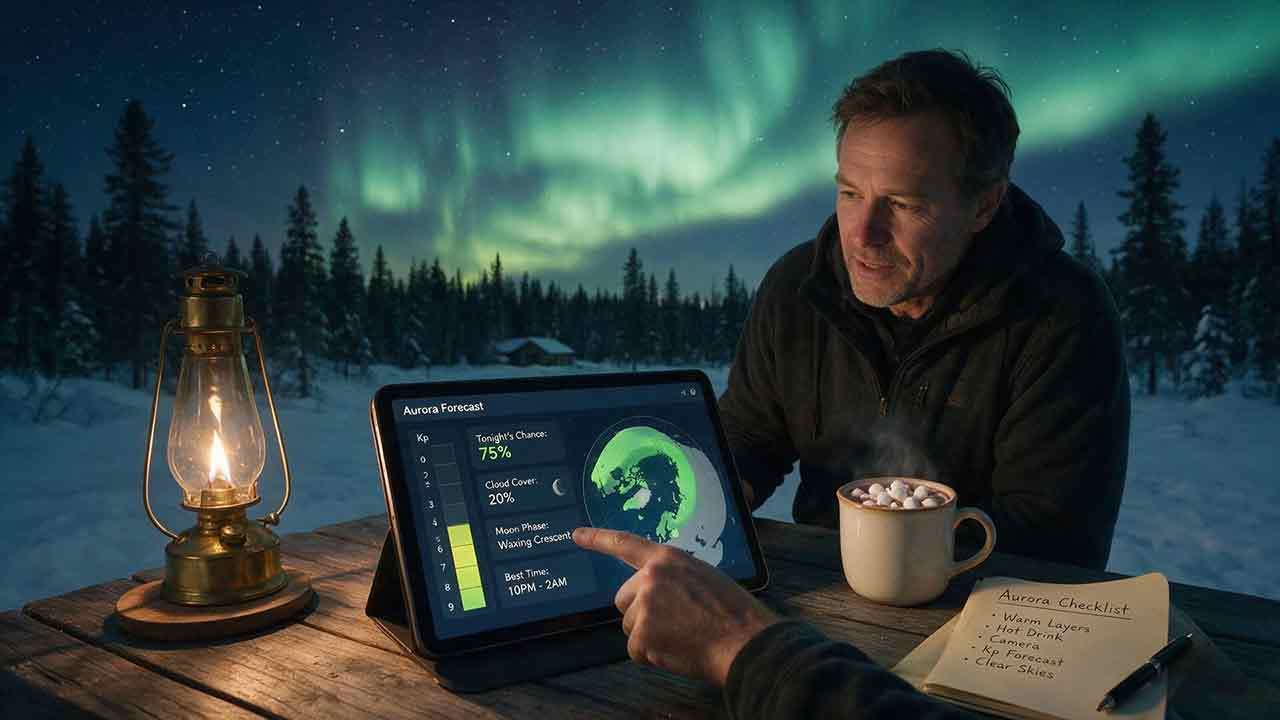
How to Read an Aurora Forecast
To read an aurora forecast, first check whether the auroral oval is near your location and whether the forecast time overlaps with local darkness. Then use Kp, Bz, solar-wind conditions, cloud cover, and recent observations as supporting evidence. No single number can guarantee a visible display, and even a strong space-weather forecast cannot overcome daylight or solid cloud.
Key Takeaways
- The auroral oval is usually more useful for a specific location than a Kp number alone.
- Kp describes broad geomagnetic activity over three-hour intervals; it is not a city-level visibility forecast.
- Sustained southward, or negative, Bz can support stronger geomagnetic activity, but it does not guarantee visible aurora.
- Darkness, cloud cover, visibility, terrain, and artificial light determine whether activity in space can be seen from the ground.
- Use long-range forecasts for planning and short-range maps, live cameras, and current solar-wind data for the final decision.
This guide explains how to read an aurora forecast step by step, convert forecast times correctly, judge whether an auroral oval may be visible from your location, and decide whether to go outside, wait for an update, relocate to clearer skies, or stay home.
Editorial note: This guide is based on published NOAA and NASA documentation, operational forecast products, and practical viewing criteria. It does not claim hands-on testing of every aurora app, scientific peer review, or guaranteed visibility.
What Does an Aurora Forecast Actually Tell You?
An aurora forecast estimates where auroral activity may occur, how intense it may become, and when conditions may be favorable. It does not predict exactly what one person will see from a particular address.
Auroras occur when energetic particles interact with Earth’s magnetic environment and upper atmosphere. When those particles transfer energy to atmospheric atoms and molecules, the released energy can appear as visible light. NASA provides a detailed explanation of this process.
For practical viewing, every forecast has two separate layers:
- Space conditions: Is auroral activity likely to reach or become visible from your region?
- Ground conditions: Will the sky be dark, clear, unobstructed, and sufficiently free from artificial light?
Space-weather products help answer the first question. Local weather, terrain, daylight, and site conditions answer the second.
What can an aurora forecast estimate?
A forecast may estimate:
- The position and intensity of the auroral oval
- The expected level of geomagnetic disturbance
- The likely timing of increased activity
- Whether the oval may expand farther from the magnetic poles
- Whether current solar-wind conditions appear more or less favorable
What can an aurora forecast not guarantee?
A forecast cannot guarantee:
- A cloud-free view
- An overhead display
- A particular color or shape
- Activity throughout an entire forecast window
- Visibility to the unaided human eye
- That a camera and the human eye will record the same brightness or color
The most accurate conclusion is not “the aurora will appear.” It is that the available evidence creates a weaker or stronger viewing opportunity.
Which Aurora Forecast Timeframe Should You Use?
Use different forecast products at different stages of planning. A forecast issued several weeks ahead cannot provide the same local precision as a short-range auroral oval map.
| Forecast horizon | Best use | What it can help you decide |
|---|---|---|
| About 27 days | Early trip planning | Which dates may deserve closer monitoring |
| 1–3 days | Preparing for a possible viewing night | Whether to keep a night free, charge equipment, and scout locations |
| 30–90 minutes | Making a near-term decision | Whether modeled aurora is approaching or covering your region |
| Real time | Confirming what is happening | Whether cameras, magnetometers, or observers are detecting activity |
How should you use a 27-day outlook?
Use a 27-day outlook to identify dates worth monitoring, not to promise a display at a specific hour.
Some solar-wind structures can recur as the Sun rotates, giving forecasters a basis for broad advance outlooks. However, timing and intensity can change substantially before the predicted date.
How should you use a three-day forecast?
Use a three-day forecast to decide whether to:
- Keep a night available
- Prepare warm clothing
- Charge batteries
- Check possible viewing sites
- Follow official watches and updated forecasts
NOAA’s three-day space-weather forecast includes expected conditions and forecaster reasoning. The written discussion can be more useful than the highest predicted Kp because it explains the source and uncertainty of possible activity.
How should you use NOAA’s short-range forecast?
Use the short-range product for the final go, wait, or relocate decision.
The product is commonly called NOAA’s Aurora 30-Minute Forecast, while its usable lead time can range from about 30 to 90 minutes. The difference exists because the lead time depends on how long the measured solar wind takes to travel from upstream monitoring spacecraft near the L1 region to Earth.
NOAA states that its Aurora 30-Minute Forecast uses the OVATION model to estimate the location and intensity of the aurora with approximately 30 to 90 minutes of lead time. If upstream solar-wind data are unavailable and the model uses Kp instead, there may be no forecast lead time.
How Do You Read an Aurora Forecast Step by Step?
A reliable reading process moves from geographical reach to timing, current space conditions, and local visibility.
Step 1: Find Your Location Relative to the Auroral Oval
Start with the latest northern- or southern-hemisphere auroral oval map.
The auroral oval is the ring-shaped region around a magnetic pole where auroral activity is concentrated. During stronger geomagnetic activity, the oval can expand farther from the pole.
Ask:
- Is my location under the modeled oval?
- Is my location close enough to see the oval near the poleward horizon?
- Is my side of Earth dark during the forecast period?
If you are under the oval, the aurora may appear overhead or across a large part of the sky. If the oval remains poleward of your location, the display may appear low on the northern horizon in the Northern Hemisphere or low on the southern horizon in the Southern Hemisphere.
Being outside the colored oval does not always mean that nothing can be seen. NOAA explains that a sufficiently bright aurora may sometimes be visible from as far as approximately 1,000 kilometers away when viewing conditions and the horizon are favorable. This is a maximum-distance possibility, not a normal visibility rule.
Step 2: Check the Map’s Timestamp and Valid Time
A forecast’s issue time tells you when the product was published. Its valid time tells you when the prediction applies.
Confusing the two can make an accurate forecast look wrong. On an animated map, determine whether you are viewing:
- The newest frame
- An earlier observation
- A forecast frame
- A loop containing several hours of data
Refresh the original forecast page rather than relying on a screenshot shared through social media.
Step 3: Convert UTC to the Correct Local Date and Time
Many space-weather products use Coordinated Universal Time, or UTC. Your local date may differ from the date shown on the forecast.
Suppose a forecast identifies a possible peak at:
03:00 UTC on January 16
For a location using Central Standard Time, which is UTC−6:
03:00 UTC − 6 hours = 21:00 local time
The local time is therefore:
9:00 p.m. on January 15
The date moves back one day because the conversion crosses midnight.
Always verify your local UTC offset for the observation date. Daylight-saving rules may change the offset during the year.
Step 4: Read Kp and the NOAA G Scale
The Planetary K-index, or Kp, describes the overall disturbance of Earth’s magnetic field on a scale from 0 to 9.
NOAA calculates an estimated planetary Kp for three-hour intervals. According to NOAA’s Planetary K-index documentation, Kp 5 or above represents geomagnetic storm conditions.
The NOAA geomagnetic storm scale relates Kp to the following levels:
| Kp | NOAA storm level | Broad description |
|---|---|---|
| Below 5 | No G-level storm | Quiet, unsettled, or active conditions |
| 5 | G1 | Minor geomagnetic storm |
| 6 | G2 | Moderate geomagnetic storm |
| 7 | G3 | Strong geomagnetic storm |
| 8 or 9− | G4 | Severe geomagnetic storm |
| 9 | G5 | Extreme geomagnetic storm |
The official definitions are available on NOAA’s Space Weather Scales.
Important limitation: This table describes broad geomagnetic conditions. It is not a guaranteed visibility-boundary table for individual cities.
Use Kp to understand the overall level of geomagnetic activity. Do not use it as the only answer to “Will I see the aurora from my location?”
Step 5: Check Bz and the Solar-Wind Trend
The solar wind is a flow of charged particles and magnetic field carried outward from the Sun. NOAA monitors solar-wind plasma and magnetic-field measurements from spacecraft upstream of Earth, generally near the L1 region.
The Bz value describes the north–south orientation of the interplanetary magnetic field:
- Negative Bz: The magnetic field is directed southward and is generally more favorable for transferring solar-wind energy into Earth’s magnetosphere.
- Positive Bz: The field is directed northward and is generally less favorable for sustained energy transfer.
- Rapidly changing Bz: Conditions may be unstable and difficult to interpret from a single reading.
NASA explains that sustained periods of high-speed solar wind—and, most importantly, a southward-directed solar-wind magnetic field—are effective at transferring energy into Earth’s magnetosphere. See NASA’s Heliophysics Big Idea 2.2.
A brief negative Bz reading is not enough to guarantee a visible response. Look for a sustained pattern and confirm whether the auroral oval, Kp, or regional magnetometers are responding.
Step 6: Check Darkness, Cloud Layers, and Visibility
A strong aurora can be physically present above an overcast sky and remain completely invisible from the ground.
Check:
- Total cloud cover
- Low, middle, and high cloud layers
- Fog or low stratus
- Snow, rain, smoke, dust, or haze
- Twilight and sunrise times
- Moon position and brightness
- Artificial light near the viewing site
- Whether the poleward horizon is unobstructed
NOAA identifies geomagnetic activity, location, darkness, and timing as major viewing factors in its aurora-viewing guidance.
A moderate forecast under a clear, dark sky may provide a better viewing experience than a major geomagnetic storm behind solid cloud.
Step 7: Look for Real-Time Confirmation
Before driving a long distance, check whether observations support the forecast.
Useful confirmation sources include:
- Regional all-sky cameras
- Ground magnetometer activity
- Recent time-stamped photographs
- Reports from observers closer to the auroral oval
- Official geomagnetic alerts
- A test photograph from your location
All-sky cameras can be particularly useful because they show whether activity is already visible under local skies. The University of Alaska Fairbanks aurora forecast page provides forecast information and access to several Alaska camera feeds.
Reports from other observers are supporting evidence, not proof that conditions at your location are identical. Check the report’s time, direction, exposure settings, and geographical position.
How Should You Interpret the Kp Index?
Higher Kp generally indicates stronger global geomagnetic disturbance and a greater possibility that the auroral oval will expand farther from the magnetic poles.
| Kp range | Broad interpretation | Practical meaning |
|---|---|---|
| 0–2 | Quiet to low activity | Aurora is generally concentrated at high magnetic latitudes |
| 3–4 | Unsettled to active | Good displays may occur within or near the normal auroral zone |
| 5 | G1 minor storm | Some locations farther from the pole may gain a viewing opportunity |
| 6 | G2 moderate storm | The oval may expand toward more mid-latitude locations |
| 7 | G3 strong storm | Substantial equatorward expansion is possible |
| 8 | G4 severe storm | Aurora may be visible well beyond its normal region |
| 9 | G5 extreme storm | Very extensive visibility is possible, subject to local conditions |
This table is a general interpretation, not a city-by-city promise.
Why can the same Kp produce different results?
The same Kp can lead to different experiences because:
- Geomagnetic latitude is not the same as geographic latitude.
- Activity is not distributed evenly around the oval.
- The strongest period may occur during daylight at your location.
- A three-hour interval can contain short peaks and quieter periods.
- Clouds, haze, and artificial light vary from place to place.
- A camera can detect weak color that the eye perceives as gray or pale green.
What Kp is required at your location?
There is no universal Kp threshold for every city.
A person within the normal auroral zone may see a good display at Kp 2, 3, or 4. A lower-latitude observer may require a substantial geomagnetic storm and still see only a faint arc near the poleward horizon.
Instead of memorizing one threshold, compare your location with the current oval and review documented observations from your region during earlier events.
How Do Bz and Solar-Wind Speed Work Together?
Bz and solar-wind speed provide short-term context after a disturbance has reached upstream monitoring spacecraft.
| Parameter | What it represents | Potentially favorable pattern | Limitation |
|---|---|---|---|
| Bz | North–south magnetic-field direction | Sustained negative, or southward, Bz | A short negative spike may have little visible effect |
| Solar-wind speed | Speed of plasma moving toward Earth | Elevated or increasing speed | High speed alone does not guarantee strong coupling |
| Total magnetic-field strength | Strength of the interplanetary magnetic field | A stronger field combined with favorable orientation | Direction remains important |
| Density | Number of particles in a volume | A sudden increase may indicate compression or arrival of a disturbance | Density alone does not predict visible aurora |
| Kp trend | Broad geomagnetic response | Rising or sustained elevated activity | Kp covers three-hour intervals and is not a future guarantee |
Which matters more: negative Bz or high solar-wind speed?
Neither should be interpreted alone.
Fast solar wind with persistently northward Bz may create less activity than viewers expect. More moderate wind with a sustained southward magnetic field can sometimes transfer energy more effectively.
A practical reading sequence is:
- Look for a sustained negative Bz trend.
- Check whether solar-wind speed and total magnetic-field strength are elevated or increasing.
- Watch for a response in Kp, magnetometers, or the auroral oval.
- Give more weight to the combined trend than to one maximum reading.
How Do You Read NOAA’s Aurora Map?
NOAA’s OVATION-based map estimates auroral location and intensity using upstream solar-wind measurements.
1. Choose the correct hemisphere
Select:
- Northern Hemisphere for the aurora borealis
- Southern Hemisphere for the aurora australis
2. Locate your region
Polar projections may look unfamiliar because the magnetic-pole region is near the center of the map.
Find your country, state, province, or nearby coastline before interpreting the oval.
3. Identify the colored oval
NOAA generally displays the modeled aurora as a green oval, with red indicating greater predicted intensity.
Your location may be:
- Inside the oval: Aurora may appear overhead or across much of the sky.
- Near the oval: Aurora may be visible toward the poleward horizon.
- Well outside the oval: Visibility is less likely unless the oval expands or becomes unusually bright.
4. Check the day–night boundary
The lighter portion of the NOAA map represents the sunlit side of Earth. Aurora can occur above the atmosphere during daylight, but it is normally not visible from the ground against a bright sky.
5. Read the forecast time
Make sure the displayed frame overlaps with darkness at your location. A favorable oval several hours before sunset may not remain favorable after dark.
6. Remember that it is not a cloud map
The OVATION model estimates auroral conditions. It does not know whether your local sky is cloudy, foggy, smoky, or blocked by terrain.
Which Matters More: Kp, the Oval, Bz, or the Weather?
Each tool answers a different question.
| Question | Most useful tool |
|---|---|
| Is geomagnetic activity expected tomorrow? | NOAA three-day forecast |
| How disturbed is Earth’s magnetic field globally? | Kp and the NOAA G scale |
| Is modeled aurora close to my location now? | Short-range auroral oval map |
| Are upstream conditions becoming more favorable? | Bz and solar-wind measurements |
| Will I be able to see the sky? | Local cloud and visibility forecast |
| Is aurora already visible nearby? | All-sky cameras and recent observations |
For an immediate decision, the oval shows geographical reach and the weather forecast shows whether you can see the sky. Kp and Bz provide context rather than replacing those two checks.
The CosmoBasics Four-Gate Aurora Viewing Framework
The CosmoBasics Four-Gate Aurora Viewing Framework is an editorial decision tool created for this guide. It organizes established viewing factors into a practical sequence. It is not a scientific forecast model, an official NOAA system, or a guarantee of visibility.
Gate 1: Reach
Question: Is the modeled aurora over your location or close enough to be visible near the poleward horizon?
- Pass: Your location is under, near, or plausibly within viewing distance of the oval.
- Uncertain: The oval is nearby but weakening, narrow, or moving.
- Fail: The oval is far poleward with no evidence of expansion.
Gate 2: Darkness
Question: Will the sky be dark enough during the predicted activity?
- Pass: The Sun is sufficiently below the horizon and stars are visible.
- Uncertain: Twilight overlaps part of the forecast window.
- Fail: Daylight or persistent high-latitude summer twilight dominates.
Gate 3: Sky
Question: Is enough of the relevant sky clear?
- Pass: The poleward horizon or overhead sky has substantial clear areas.
- Uncertain: Broken clouds are moving through.
- Fail: Solid cloud, fog, smoke, or heavy precipitation blocks the sky.
Gate 4: Timing
Question: Do the forecast, darkness, clear conditions, and your availability overlap?
- Pass: The useful windows overlap.
- Uncertain: The disturbance may arrive before darkness or after clouds increase.
- Fail: The forecast peak occurs outside the usable viewing period.
How should you act on the four gates?
| Result | Practical response |
|---|---|
| Four passes | Go to the selected viewing site |
| Three passes and one uncertain | Consider going when travel is short and conditions are safe |
| Two or more uncertain | Wait for updated maps, cameras, or reports |
| Reach passes but Sky fails | Consider a safe nearby clear area |
| Reach fails | Continue monitoring rather than making a long speculative drive |
| Darkness fails | Choose a later time, another night, or a different season |
This framework is intentionally conservative. It prevents an exciting Kp prediction from outweighing daylight, dangerous roads, complete cloud cover, or a poor horizon.
Worked Example Using Hypothetical Forecast Data
The values below are invented for demonstration. They are not a current or historical forecast and should not be used to plan a real viewing trip.
Consider a hypothetical observer near Duluth, Minnesota, during winter.
The example information is:
- Three-day forecast: possible G1 geomagnetic storm
- Possible active period: 03:00–06:00 UTC
- Local time zone: Central Standard Time, UTC−6
- Auroral oval: near northern Minnesota
- Bz: recently negative but variable
- Cloud forecast: 25% cloud cover early, increasing after midnight
- Dark viewing site: approximately 30 minutes away
Step 1: Convert the time
03:00–06:00 UTC = 9:00 p.m.–12:00 a.m. CST
The possible activity overlaps with darkness.
Step 2: Apply the four gates
- Reach: Pass. The modeled oval is close enough to create a reasonable opportunity.
- Darkness: Pass. The full period occurs after dark.
- Sky: Pass early, uncertain later. Cloud cover is expected to increase.
- Timing: Pass. The possible activity overlaps with the clearest period.
Decision
The reasonable decision is to arrive early rather than wait for the middle of the forecast window. Immediately before leaving, the observer should check the newest oval map, current clouds, road conditions, and nearby camera feeds.
The example does not assume that G1 conditions guarantee visible aurora. It shows how several moderate indicators can combine into a worthwhile but uncertain opportunity.
Aurora Forecast Checklist
Use this checklist during the final hour before leaving.
Space-weather checks
- The latest auroral oval is near or over my region.
- I checked the map’s timestamp and valid time.
- I converted UTC to the correct local date and time.
- Kp and the NOAA G scale support at least some possibility of activity.
- Bz and solar-wind trends are not clearly deteriorating.
- Cameras, magnetometers, or observers provide supporting evidence.
Ground-condition checks
- The sky will be sufficiently dark.
- The poleward horizon or overhead sky is at least partly clear.
- Fog, smoke, snow, rain, or haze will not block the view.
- The location has limited direct artificial lighting.
- Buildings, mountains, or dense trees do not block the relevant horizon.
- Roads and weather conditions are safe.
Travel and site-safety checks
- Parking is legal and safely separated from moving traffic.
- I will not stop in an active traffic lane or on an unsafe road shoulder.
- I will follow road closures, park rules, severe-weather alerts, and emergency instructions.
- I will not enter private, restricted, or closed land.
- My vehicle has adequate fuel or charge.
- Someone knows my destination if the location is remote.
- My clothing and emergency supplies are suitable for the conditions.
Equipment checks
- Phone and camera batteries are charged.
- Spare batteries can be kept warm in cold weather.
- Lens cloths are available for condensation or frost.
- A red or low-brightness light can be used without ruining night vision.
- The plan does not depend on a camera revealing what the eye must see.
What Are the Most Common Aurora Forecast Mistakes?
Treating Kp as a local visibility percentage
Kp is a global geomagnetic index. It is not the probability that one person will see aurora from one address.
Better approach: Use Kp for context and the oval for geographical relevance.
Ignoring magnetic latitude
Locations at similar geographic latitudes can have different relationships to the auroral oval.
Better approach: Compare your location directly with a polar forecast map.
Forgetting to convert UTC
A forecast dated Saturday in UTC may correspond to Friday evening locally.
Better approach: Write down the local start and end times before making plans.
Looking at an old map or screenshot
Shared screenshots may continue circulating after the conditions have changed.
Better approach: Open the original forecast product and confirm its timestamp.
Assuming a solar flare means immediate aurora
A flare’s light reaches Earth much sooner than a slower-moving plasma disturbance capable of causing a geomagnetic storm.
Better approach: Wait for an official geomagnetic forecast and evidence that an Earth-directed disturbance is approaching or arriving.
Ignoring clouds because Kp is high
Kp describes space conditions. Clouds determine whether you can see the sky.
Better approach: Once the oval is within range, prioritize darkness and clearer local weather.
Expecting photographs and eyesight to match
A camera can collect light for longer than the eye and may record colors that appear gray, white, or very faint in person.
Better approach: Allow time for dark adaptation and use a short exposure only as a detection aid.
Leaving after five quiet minutes
Auroral activity can brighten, fade, and reorganize over short periods.
Better approach: If conditions remain favorable and it is safe, observe for a reasonable window rather than judging the night immediately.
How Do You Troubleshoot an Aurora Forecast?
The forecast is strong, but I see nothing
Check:
- Are you looking toward the correct horizon?
- Is the display hidden behind terrain, trees, or buildings?
- Are thin clouds or haze reflecting artificial light?
- Is the displayed forecast frame still current?
- Has the oval contracted or moved away?
- Has Bz turned northward?
- Are nearby cameras showing activity in another part of the oval?
- Is the aurora visible only in a camera exposure?
Kp is high, but the oval is not over my location
Kp describes global disturbance, while auroral brightness is not distributed evenly around every longitude.
A high Kp can support a wider oval without placing the brightest activity over every location at the same time.
My app and NOAA disagree
Different services may use:
- Different data-refresh times
- Different models
- Kp-only estimates
- Proprietary local scores
- Different cloud or moonlight inputs
- Different definitions of “visibility”
Check the timestamp and determine whether the app is displaying an official forecast, modifying official data, or generating its own prediction.
The oval reaches my region during daylight
The aurora may be physically present but hidden by sunlight.
Review later forecast frames to see whether favorable conditions may persist after local darkness begins.
Bz is negative, but Kp has not increased
The negative orientation may be too brief, the total magnetic field may be weak, or Earth’s response may not yet be visible in the Kp estimate.
Continue watching the trend rather than assuming one negative reading must produce an immediate storm.
How Should You Plan an Aurora Trip?
For an aurora-focused trip, flexibility is usually more valuable than one high long-range Kp prediction.
Prefer a plan with:
- Several possible viewing nights
- Long periods of darkness
- More than one viewing location
- Access to different local weather zones
- Safe roads and legal parking
- Low artificial light
- A clear poleward horizon
- Flexible cancellation or itinerary options
The University of Alaska Fairbanks notes that darkness and at least partly clear skies are essential. Its guidance also explains that the best viewing period is commonly centered around local midnight, although weather and sunrise or sunset times determine the practical window.
NOAA gives a broadly similar rule of thumb, noting that active aurora is often most favorable within an hour or two of local midnight—approximately 10:00 p.m. to 2:00 a.m.—while also explaining that stronger activity can extend useful viewing into earlier evening or later morning hours.
These are planning guidelines, not restrictions. Aurora can appear outside the typical window.
What This Article Does Not Claim
- This article does not guarantee that aurora will be visible from any location.
- The Four-Gate Framework is an editorial decision tool, not an official forecast model.
- The Duluth worked example uses invented values and is not a real forecast.
- A phone photograph does not prove that the eye will see the same brightness or color.
- This article does not replace official weather warnings, road closures, park rules, or emergency instructions.
How Should You Use an Aurora Forecast Tonight?
Start with the newest auroral oval rather than an isolated Kp number or social-media screenshot. Confirm the valid time, convert UTC correctly, and check whether the oval is within viewing range.
Next, assess darkness and cloud cover. Use Bz, solar-wind data, cameras, and observer reports as supporting evidence. Apply the Four-Gate Framework only after checking road and site safety.
Recommended next steps by viewer type
First-time viewer: Focus on the oval, local clouds, darkness, and safe access. Do not feel required to interpret every solar-wind chart.
Local observer: Keep notes on which oval positions, Kp levels, directions, and local weather patterns have produced sightings from your usual location.
Traveler: Build flexibility into the trip and choose several nights rather than relying on one forecast peak.
Photographer: Check moonlight, foreground visibility, wind, condensation, battery performance, and legal parking in addition to auroral activity.
Lower-latitude observer: Wait for official geomagnetic watches or storm forecasts, find a dark poleward horizon, and expect the first signs to appear low in the sky rather than overhead.
The practical conclusion is simple: check reach, darkness, sky, and timing in that order. When all four align, you have a meaningful opportunity—not a guarantee.
Frequently Asked Questions
Is Kp 5 enough to see the northern lights?
Kp 5 corresponds to a G1 minor geomagnetic storm, but it is not a universal visibility threshold. It may produce good activity within the normal auroral zone while creating only a faint horizon glow, or no visible result, farther away. Check the current oval, magnetic latitude, darkness, and clouds.
Can aurora be visible outside the forecast oval?
Yes. A bright aurora may be visible from outside the modeled oval, especially from a dark site with an unobstructed poleward horizon. The farther you are from the active oval, the lower the display is likely to appear in the sky.
Is negative Bz always good for aurora?
Negative, southward Bz is generally favorable for transferring energy into Earth’s magnetosphere, but it does not guarantee visible aurora. Duration, total magnetic-field strength, solar-wind speed, location, darkness, and weather also matter.
Should I trust an aurora app’s percentage?
Treat an app percentage as a simplified estimate unless the service clearly explains its model, data sources, update time, and weather inputs. Compare the score with an official auroral oval and check whether the app is using current data.
Can I see aurora through clouds?
Solid cloud normally prevents a meaningful ground view. Thin or broken cloud may allow partial visibility, but it can also scatter moonlight and artificial light. Auroral activity detected above the clouds does not mean a ground observer can see it.
What is the best time of night to see aurora?
The hours around local midnight are often productive, but the best time on a particular night is when modeled activity, darkness, and clear weather overlap. Strong geomagnetic activity can produce displays earlier in the evening or later toward morning.
How This Article Was Reviewed
This article was editorially reviewed on August 1, 2026. The review included:
- Checking NOAA’s definition of Kp and its three-hour intervals
- Confirming the NOAA G1–G5 geomagnetic storm scale
- Confirming the purpose and 30–90-minute lead-time range of the NOAA OVATION product
- Checking NOAA’s statements about viewing distance, darkness, magnetic latitude, and typical midnight-centered viewing hours
- Reviewing NASA’s explanation of aurora formation and southward solar-wind magnetic fields
- Reviewing University of Alaska Fairbanks guidance on darkness, clear skies, time of night, and forecast horizons
- Rechecking the UTC conversion used in the hypothetical example
- Separating official scientific information from the original editorial framework and invented demonstration data
This was an editorial fact-check, not scientific peer review. No independent measurements, product tests, or field observations are claimed.
Sources
NOAA Space Weather Prediction Center — Aurora 30-Minute Forecast
Supports the explanation of the OVATION model, map colors, daylight boundary, viewing distance, and variable 30–90-minute lead time.NOAA Space Weather Prediction Center — Planetary K-index
Supports the definition of Kp, its three-hour intervals, and the geomagnetic-storm threshold.NOAA Space Weather Prediction Center — NOAA Space Weather Scales
Supports the G1–G5 classifications and associated Kp values.NOAA Space Weather Prediction Center — Tips on Viewing the Aurora
Supports the discussion of location, magnetic latitude, darkness, Kp limitations, and typical viewing hours.NOAA Space Weather Prediction Center — Solar Wind Observations
Describes the upstream solar-wind plasma and magnetic-field measurements used by forecasters.NOAA Space Weather Prediction Center — 3-Day Forecast
Provides short-range forecast information and operational forecaster discussion.NOAA Space Weather Prediction Center — 27-Day Outlook
Provides longer-range geomagnetic outlook information for early planning.NASA Science — Auroras
Supports the scientific explanation of how energetic particles and atmospheric gases produce auroral light.NASA Science — Heliophysics Big Idea 2.2
Supports the explanation of solar wind, magnetic reconnection, and the importance of sustained southward magnetic fields.University of Alaska Fairbanks Geophysical Institute — Aurora Forecast
Supports guidance on forecast horizons, darkness, clear skies, viewing hours, and real-time camera use.
Sources accessed: August 1, 2026
Editorial review: Fact-checked against the authoritative sources listed above. No scientific peer review or hands-on product testing is claimed.
More from Aurora Forecasting & Viewing
How to Photograph the Northern Lights
Photographing the Northern Lights requires more than choosing one fixed camera setting. This practical guide explains how to select a camera and lens, focus accurately on stars, stabilize your equipment, and adjust shutter speed, aperture, and ISO according to the aurora’s brightness and movement. It includes starting settings for fast, moderate, and faint displays, along with a Motion–Brightness–Foreground framework that helps photographers make better decisions as conditions change. Readers will also learn how to use a smartphone Night mode, compose a stronger foreground, protect color-channel highlights, edit images responsibly, and disclose exposure blends clearly. A quick-reference card, three-frame comparison method, packing checklist, safety guidance, and detailed troubleshooting table make the article useful in the field. The guide relies on published guidance from NASA, NOAA, Nikon, Canon, and Apple while clearly distinguishing authoritative information from adjustable photography recommendations.
How Far South Can the Northern Lights Be Seen?
The northern lights usually remain within high-latitude regions, but powerful geomagnetic storms can carry visible aurora surprisingly far south. This guide explains why there is no single worldwide southern boundary and shows how geomagnetic latitude, the auroral oval, Kp, storm intensity, emission altitude, darkness, cloud cover, and local light pollution affect what an observer may see. It examines NOAA’s generalized U.S. visibility examples for G1 through G5 storms, while clarifying that locations such as Alabama, Florida, and southern Texas represent rare historical possibilities rather than guaranteed forecast limits. Readers will also find an original four-gate decision framework, an auditable geometric viewing-distance example, regional viewing guidance, a practical checklist, and troubleshooting advice for distinguishing faint aurora from clouds or artificial sky glow. The article helps observers decide when a forecast justifies going outside or traveling to a safer, darker viewing site.
What Are the Best Conditions for Seeing the Northern Lights?
The best Northern Lights viewing conditions occur when geomagnetic activity, clear weather, darkness, and a suitable observing location align. This guide explains why the position of the auroral oval matters more than relying on a single Kp value and shows how cloud cover, twilight, light pollution, moonlight, atmospheric transparency, and horizon visibility affect what an observer can see. It introduces the Five-Gate Aurora Viewing Framework, a practical planning tool that evaluates aurora activity, clouds, darkness, location, and available viewing time without presenting the result as a guaranteed probability. Readers will also learn how to compare short- and long-range forecasts, convert UTC forecast periods, choose a safe dark-sky site, recognize faint aurora, and troubleshoot a promising forecast that produces no visible display. The article is based on guidance from NOAA, NASA, the University of Alaska Fairbanks, and the National Park Service.
Explore More Topics
Which Space Weather Measurements Matter Most for Aurora Forecasting?
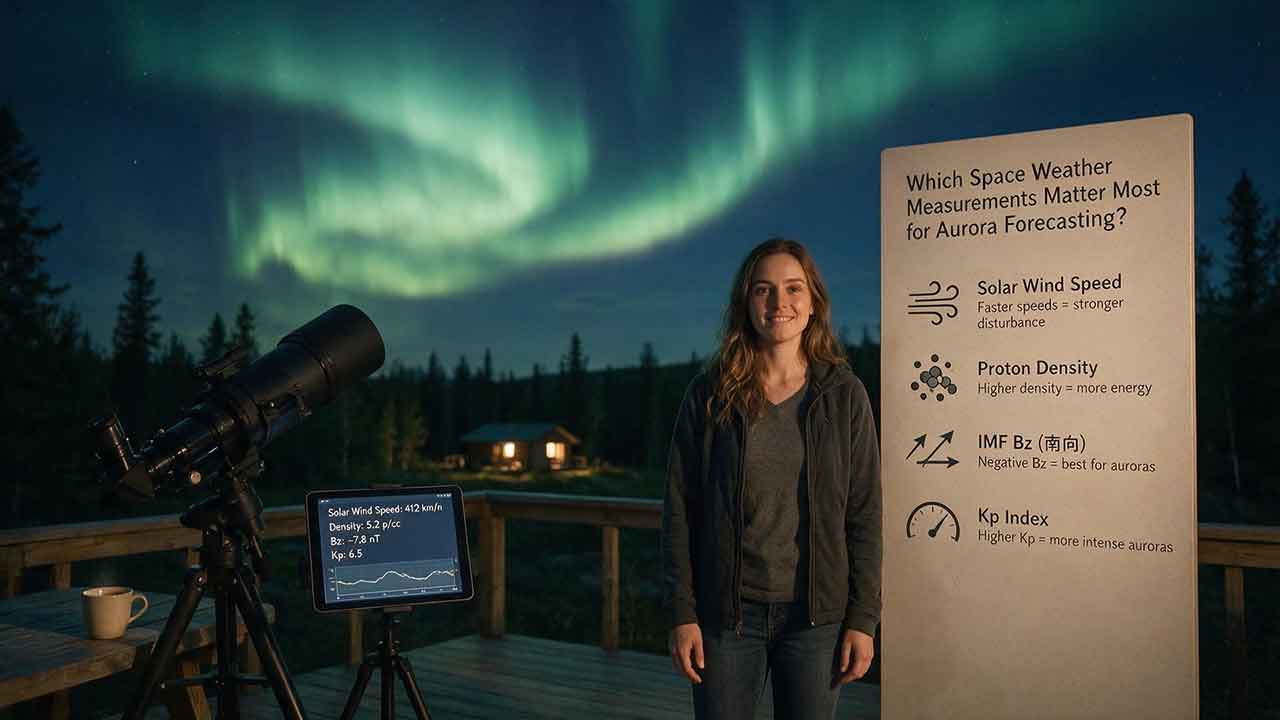
Aurora forecasting becomes more reliable when each space weather measurement is used for the right decision window. This guide explains why CME direction and propagation models matter several days ahead, while sustained southward Bz, total magnetic-field strength, solar-wind speed, density, and dynamic pressure become more useful as a disturbance approaches Earth. It also shows how Kp, auroral-oval maps, hemispheric power, AE, Dst, and local magnetometers answer different forecasting questions. Readers will learn a practical Signal–Coupling–Response–Visibility framework, compare upstream warning time with NOAA’s auroral-model guidance, work through a dynamic-pressure example, and troubleshoot conflicting forecast signals. The article also explains commonly overvalued indicators, including flare class, isolated Bz spikes, and Kp values without local-time context. Designed for aurora viewers, photographers, and travelers, it provides a clear checklist for combining official space weather data with darkness, cloud cover, road safety, and horizon visibility—without promising that any single measurement can guarantee a visible display.
How Reliable Are Aurora Forecast Apps?
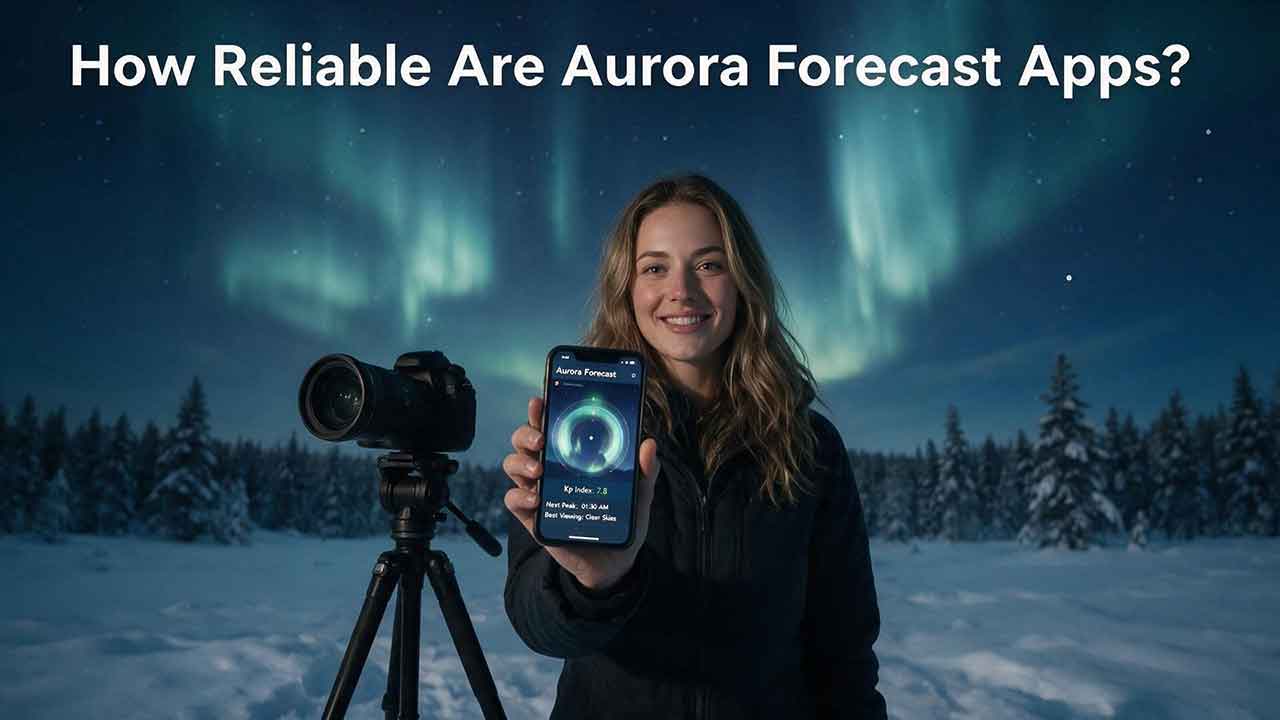
Aurora forecast apps are useful for identifying periods of elevated geomagnetic activity, but they cannot guarantee that the northern lights will be visible from a specific location at a specific time. This guide explains why app alerts sometimes disagree, how forecast reliability changes as an event approaches, and which measurements deserve the most attention. Readers will learn how to interpret the auroral oval, observed and forecast Kp, solar-wind speed, Bz, cloud cover, darkness, timestamps, and official space-weather alerts. The article also introduces the Signal-to-Sky Reliability Framework, a viewing-location comparison tool, and a transparent method for auditing app notifications without inventing accuracy claims. Practical tables, troubleshooting guidance, and a step-by-step verification process help casual observers, photographers, travelers, and lower-latitude aurora chasers decide when an alert is worth acting on. The guide is based on authoritative documentation and published research rather than hands-on commercial app rankings.
What Do G1 Through G5 Geomagnetic Storm Levels Mean?
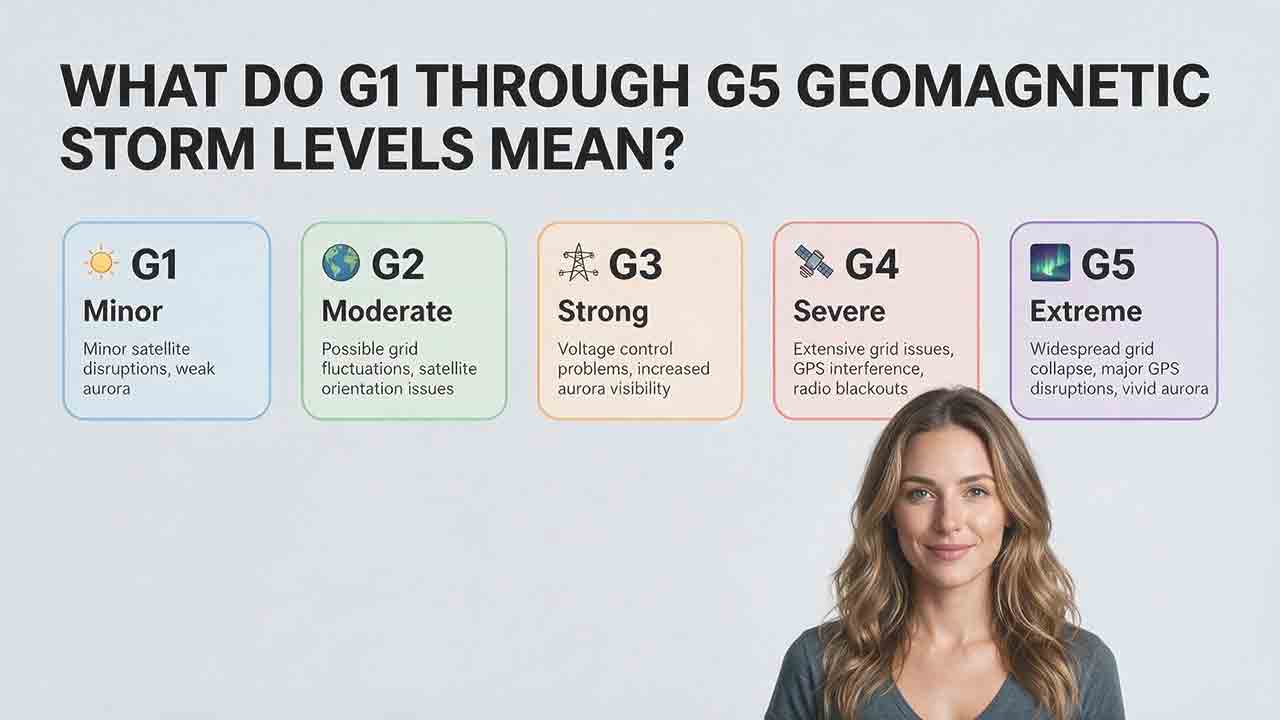
NOAA’s G1 through G5 scale ranks geomagnetic storms from minor to extreme and translates planetary Kp measurements into practical impact categories. This guide explains the exact relationship between G levels and Kp notation, including why Kp 9− remains G4 while only Kp 9o qualifies as G5. It compares the possible effects of each level on aurora visibility, power systems, satellites, high-frequency radio, GPS, and precision navigation without treating those outcomes as guaranteed. Readers also learn how to distinguish a forecast, watch, warning, and observed alert; convert UTC forecast windows; interpret decimal Kp values such as 4.67 and 8.67; and apply the Scale–Status–Window–Location–System framework. Practical tables, a G3 watch example, common mistakes, and user-specific recommendations help the public, aurora observers, and technical users respond appropriately without unnecessary alarm.